

signal strength 2 of 5
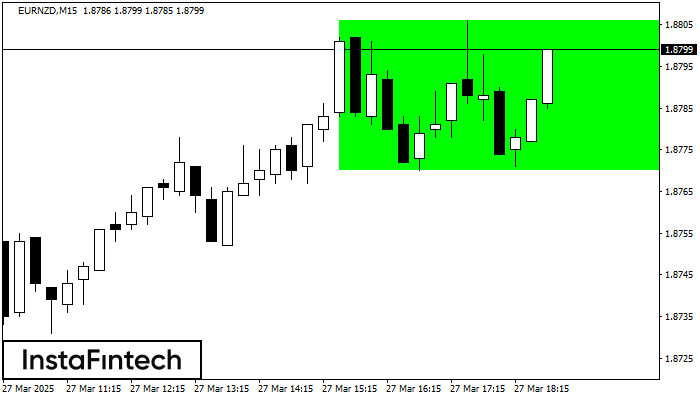
According to the chart of M15, EURNZD formed the Bullish Rectangle. The pattern indicates a trend continuation. The upper border is 1.8806, the lower border is 1.8770. The signal means that a long position should be opened above the upper border 1.8806 of the Bullish Rectangle.
The M5 and M15 time frames may have more false entry points.
انظر أيضا
- All
- Double Top
- Flag
- Head and Shoulders
- Pennant
- Rectangle
- Triangle
- Triple top
- All
- #AAPL
- #AMZN
- #Bitcoin
- #EBAY
- #FB
- #GOOG
- #INTC
- #KO
- #MA
- #MCD
- #MSFT
- #NTDOY
- #PEP
- #TSLA
- #TWTR
- AUDCAD
- AUDCHF
- AUDJPY
- AUDUSD
- EURCAD
- EURCHF
- EURGBP
- EURJPY
- EURNZD
- EURRUB
- EURUSD
- GBPAUD
- GBPCHF
- GBPJPY
- GBPUSD
- GOLD
- NZDCAD
- NZDCHF
- NZDJPY
- NZDUSD
- SILVER
- USDCAD
- USDCHF
- USDJPY
- USDRUB
- All
- M5
- M15
- M30
- H1
- D1
- All
- Buy
- Sale
- All
- 1
- 2
- 3
- 4
- 5
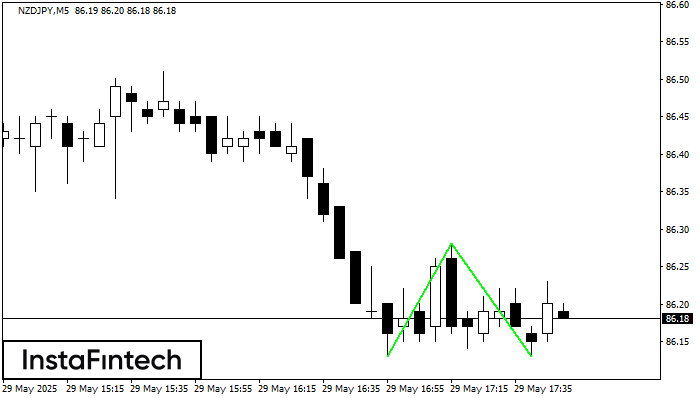
O padrão Fundo duplo foi formado em NZDJPY M5. Esta formação sinaliza uma reversão da tendência de baixo para cima. O sinal é que uma negociação de compra deve
Os intervalos M5 e M15 podem ter mais pontos de entrada falsos.
Open chart in a new window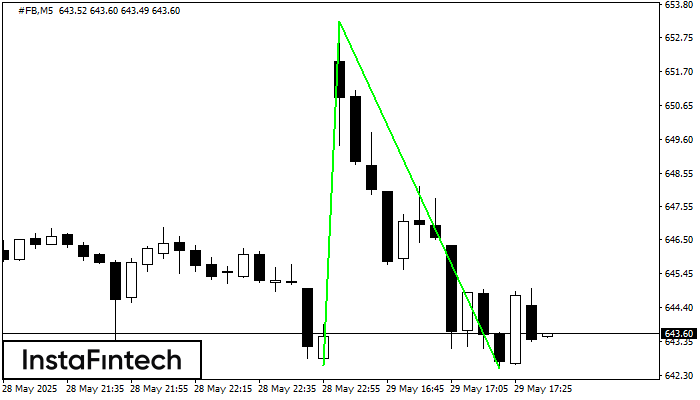
O padrão Fundo duplo foi formado em #FB M5; o limite superior é 653.26; o limite inferior é 642.54. A largura do padrão é de 1063 pontos. No caso
Os intervalos M5 e M15 podem ter mais pontos de entrada falsos.
Open chart in a new window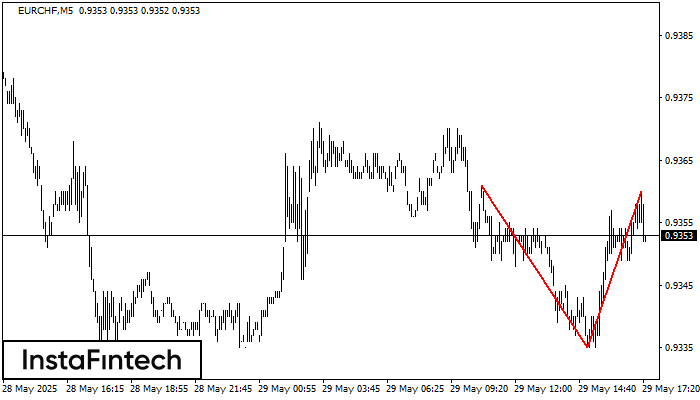
O padrão Topo duplo foi formado em EURCHF M5. Isso sinaliza que a tendência foi alterada de cima para baixo. Provavelmente, se a base do padrão 0.9335 for quebrada
Os intervalos M5 e M15 podem ter mais pontos de entrada falsos.
Open chart in a new window


