Forex Market Insight: A Technical and Fundamental Analysis of the EUR/USD Pair
Key Takeaways
- Market Sentiment: Mixed global cues with Wall Street's gains counterbalanced by losses in Asia-Pacific indices.
- Forex Impact: The Australian dollar's weakness post-RBNZ decision affects forex dynamics.
- EUR/USD Technicals: The currency pair is at a crossroads, with potential for both bullish and bearish developments.
In the world of foreign exchange, the ebbs and flows are as much about the current economic indicators as they are about the technical setups on the charts. As we delve into the EUR/USD pair, we shall consider both the fundamental factors playing out on the global stage and the technical patterns emerging on the 4-hour chart.
Fundamental Analysis
The backdrop for our analysis comes from a mix of mild optimism and caution across global markets. Wall Street ended its session with slight gains, with S&P 500 and Nasdaq 100 contracts up between 0.10-0.20%, and US500 futures closed at around 5080 points. Contrasting this optimism, Asia-Pacific indices are showing mostly weaker sessions, with Japan's Nikkei down by 0.10%, Australia's S&P/ASX 200 lower by 0.35%, and Chinese indices dropping between 1.10-1.60%.
Futures contracts for European indices are signaling a slightly lower cash session opening in the Old Continent. In the forex sphere, there haven't been significant changes except for the Australian dollar (NZD), which has lost between 0.80-1.00% against most currencies after the Reserve Bank of New Zealand's (RBNZ) interest rate decision, maintaining the rates at 5.50%. This move was anticipated by most analysts and signals a reduced likelihood of rate hikes this year, with no cuts expected until 2025.
RBNZ's chairman, Adrian Orr, mentioned that while further hikes were discussed, the consensus was that the current rate levels are sufficient. Despite high domestic inflation, prices are falling at the anticipated rate. Orr highlighted that central banks might maintain peak interest rates longer than financial markets anticipate, but the baseline scenario remains a soft landing for economies.
Adding to the geopolitical tensions, eleven Chinese naval ships were detected near Taiwan, marking continued military assertiveness by China this year. In other financial news, Barclays raised its target for the S&P 500 index by the end of 2024 to 5300 points from 4800. Moreover, the Chinese real estate market continues to struggle, with developer Country Garden Holdings facing a liquidation request over an unpaid $205 million loan by creditor Ever Credit Limited, a claim the company disputes.
Cryptocurrencies are maintaining their uptrend, with Bitcoin staying above USD 57,000, up by 0.15%, and Ethereum gaining 0.45% to USD 3,260. Smaller crypto projects are witnessing a pullback, with the total market capitalization excluding BTC and ETH remaining flat at USD 574 billion.
Technical Analysis
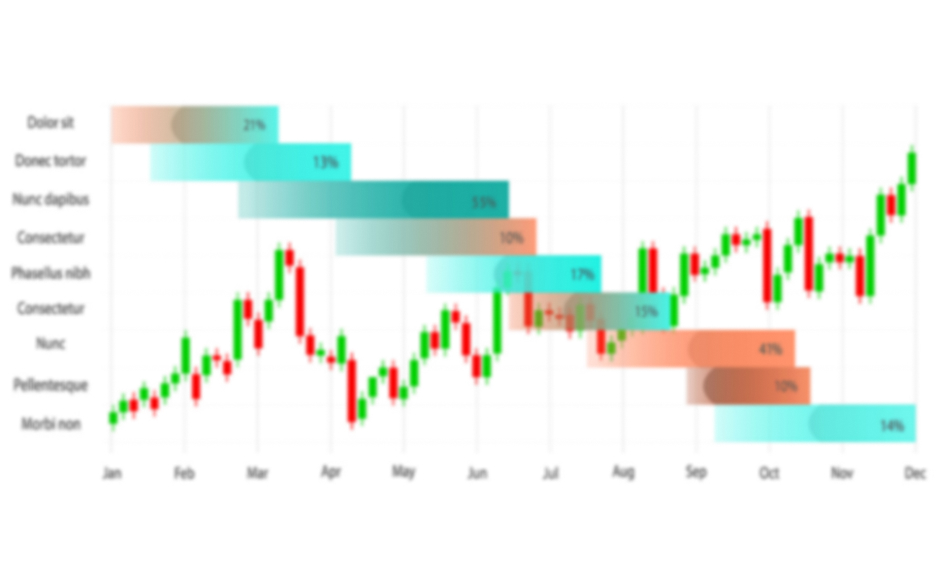
Turning to the technicals, the EUR/USD chart provides a interesting view:
- Trend Analysis: There's a slight bullish trend with the currency pair forming higher lows. However, resistance is evident near the 1.0900 supply zone.
- Candlestick Patterns: Bullish Engulfing patterns suggest buying pressure, while Bearish Engulfing patterns at the supply zone signal potential bearish reversals. A Harami pattern and a Pin Bar indicate indecision and potential reversals.
- Moving Averages: The price is hovering around the 50-period DEMA and the 100-period EMA, with the recent crossover suggesting a possible bearish trend.
- Indicators: The RSI is neutral at around 45.92, indicating a lack of strong momentum.
- Support and Resistance: The supply zone at 1.0900 is acting as resistance, while the demand zone around 1.0800 is providing support.
Market Scenarios
Given the fundamental and technical data, two scenarios emerge:
- Bullish Scenario: If the price maintains above the EMAs and breaks past the 1.0900 supply zone, we could see an acceleration of the bullish trend.
- Bearish Scenario: A sustained move below the demand zone at 1.0800 could signal a stronger bearish momentum, aligning with global uncertainties.
Useful Links
Important Notice
The begginers in forex trading need to be very careful when making decisions about entering the market. Before the release of important reports, it is best to stay out of the market to avoid being caught in sharp market fluctuations due to increased volatility. If you decide to trade during the news release, then always place stop orders to minimize losses.
Without placing stop orders, you can very quickly lose your entire deposit, especially if you do not use money management and trade large volumes. For successful trading, you need to have a clear trading plan and stay focues and disciplined. Spontaneous trading decision based on the current market situation is an inherently losing strategy for a scalper or daytrader.
#instaforex #analysis #sebastianseliga