


Actual patterns
Patterns are graphical models which are formed in the chart by the price. According to one of the technical analysis postulates, history (price movement) repeats itself. It means that the price movements are often similar in the same situations which makes it possible to predict the further development of the situation with a high probability.
Actual Patterns
- All
- Double Top
- Flag
- Head and Shoulders
- Pennant
- Rectangle
- Triangle
- Triple top
- All
- #AAPL
- #AMZN
- #Bitcoin
- #EBAY
- #FB
- #GOOG
- #INTC
- #KO
- #MA
- #MCD
- #MSFT
- #NTDOY
- #PEP
- #TSLA
- #TWTR
- AUDCAD
- AUDCHF
- AUDJPY
- AUDUSD
- EURCAD
- EURCHF
- EURGBP
- EURJPY
- EURNZD
- EURRUB
- EURUSD
- GBPAUD
- GBPCHF
- GBPJPY
- GBPUSD
- GOLD
- NZDCAD
- NZDCHF
- NZDJPY
- NZDUSD
- SILVER
- USDCAD
- USDCHF
- USDJPY
- USDRUB
- All
- M5
- M15
- M30
- H1
- D1
- All
- Buy
- Sale
- All
- 1
- 2
- 3
- 4
- 5
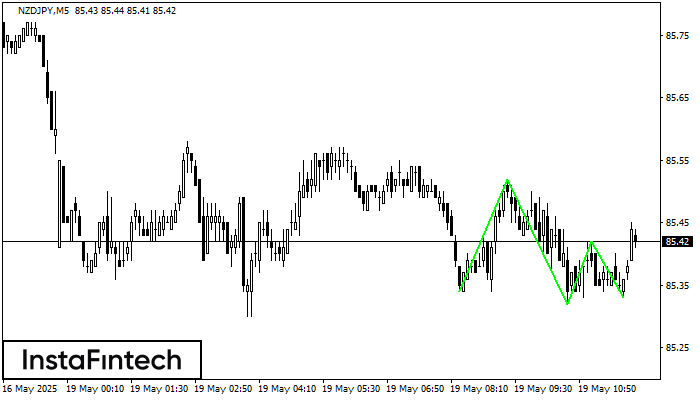
The Triple Bottom pattern has formed on the chart of the NZDJPY M5 trading instrument. The pattern signals a change in the trend from downwards to upwards in the case
The M5 and M15 time frames may have more false entry points.
Open chart in a new window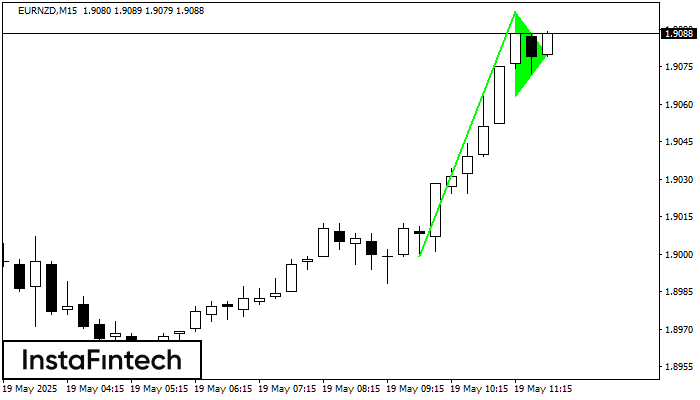
The Bullish pennant graphic pattern has formed on the EURNZD M15 instrument. This pattern type falls under the category of continuation patterns. In this case, if the quote can breaks
The M5 and M15 time frames may have more false entry points.
Open chart in a new window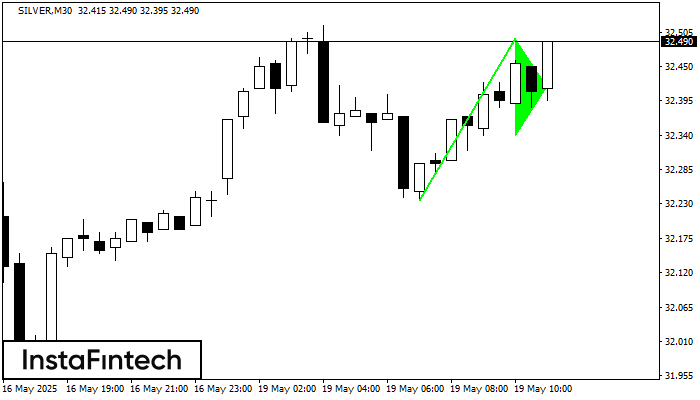
The Bullish pennant signal – Trading instrument SILVER M30, continuation pattern. Forecast: it is possible to set up a buy position above the pattern’s high of 32.49, with the prospect
Open chart in a new window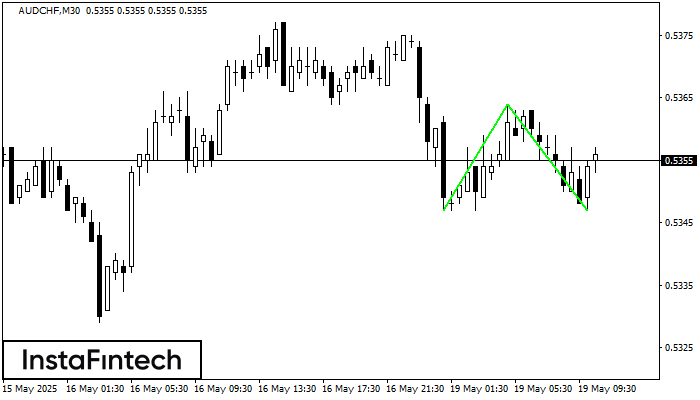
The Double Bottom pattern has been formed on AUDCHF M30; the upper boundary is 0.5364; the lower boundary is 0.5347. The width of the pattern is 17 points. In case
Open chart in a new window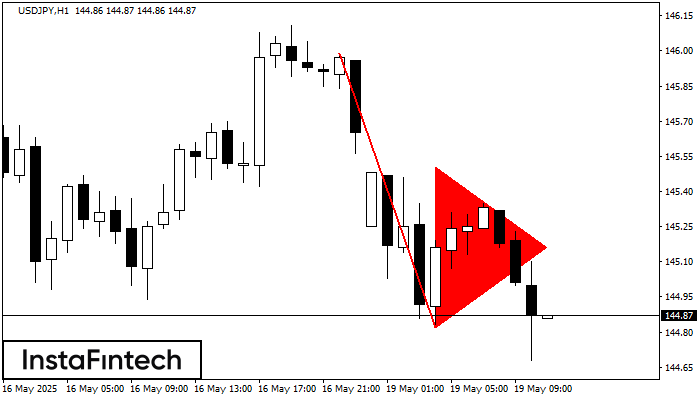
The Bearish pennant pattern has formed on the USDJPY H1 chart. It signals potential continuation of the existing trend. Specifications: the pattern’s bottom has the coordinate of 144.82; the projection
Open chart in a new window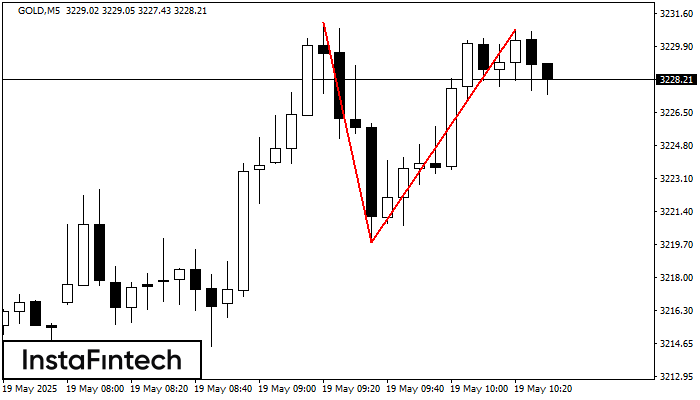
On the chart of GOLD M5 the Double Top reversal pattern has been formed. Characteristics: the upper boundary 3230.79; the lower boundary 3219.80; the width of the pattern 1099 points
The M5 and M15 time frames may have more false entry points.
Open chart in a new window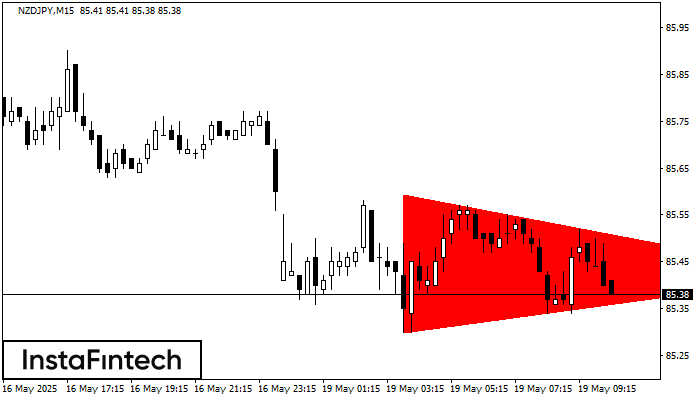
According to the chart of M15, NZDJPY formed the Bearish Symmetrical Triangle pattern. Trading recommendations: A breach of the lower border 85.30 is likely to encourage a continuation
The M5 and M15 time frames may have more false entry points.
Open chart in a new window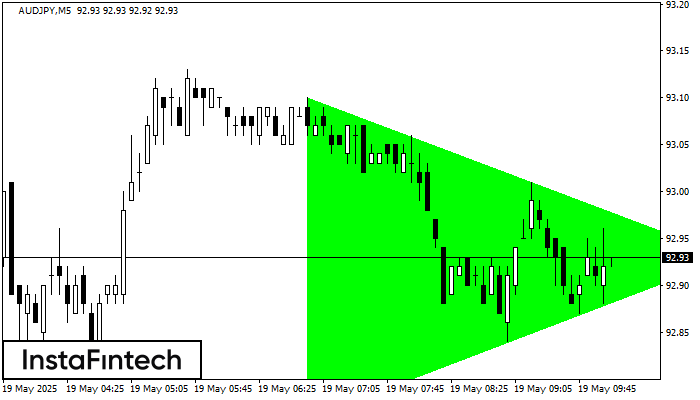
According to the chart of M5, AUDJPY formed the Bullish Symmetrical Triangle pattern, which signals the trend will continue. Description. The upper border of the pattern touches the coordinates 93.10/92.93
The M5 and M15 time frames may have more false entry points.
Open chart in a new window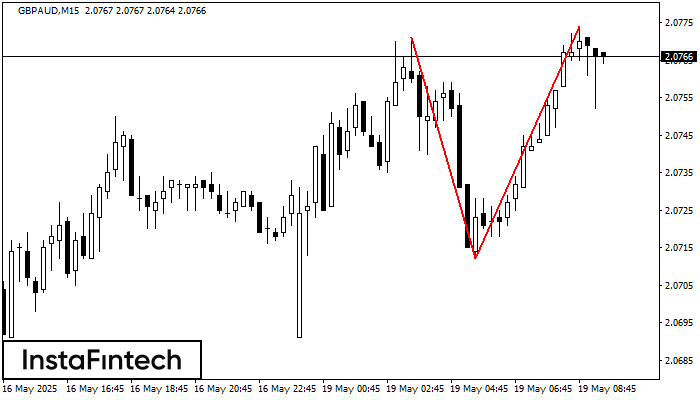
The Double Top reversal pattern has been formed on GBPAUD M15. Characteristics: the upper boundary 2.0771; the lower boundary 2.0712; the width of the pattern is 62 points. Sell trades
The M5 and M15 time frames may have more false entry points.
Open chart in a new window


