

signal strength 2 of 5
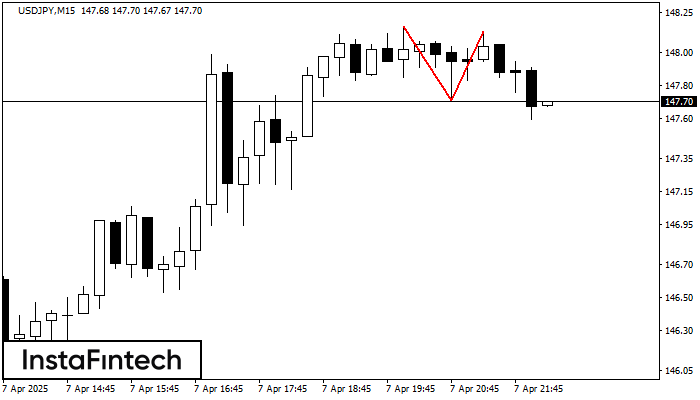
On the chart of USDJPY M15 the Double Top reversal pattern has been formed. Characteristics: the upper boundary 148.13; the lower boundary 147.71; the width of the pattern 42 points. The signal: a break of the lower boundary will cause continuation of the downward trend targeting the 147.49 level.
The M5 and M15 time frames may have more false entry points.
See Also
- All
- Double Top
- Flag
- Head and Shoulders
- Pennant
- Rectangle
- Triangle
- Triple top
- All
- #AAPL
- #AMZN
- #Bitcoin
- #EBAY
- #FB
- #GOOG
- #INTC
- #KO
- #MA
- #MCD
- #MSFT
- #NTDOY
- #PEP
- #TSLA
- #TWTR
- AUDCAD
- AUDCHF
- AUDJPY
- AUDUSD
- EURCAD
- EURCHF
- EURGBP
- EURJPY
- EURNZD
- EURRUB
- EURUSD
- GBPAUD
- GBPCHF
- GBPJPY
- GBPUSD
- GOLD
- NZDCAD
- NZDCHF
- NZDJPY
- NZDUSD
- SILVER
- USDCAD
- USDCHF
- USDJPY
- USDRUB
- All
- M5
- M15
- M30
- H1
- D1
- All
- Buy
- Sale
- All
- 1
- 2
- 3
- 4
- 5
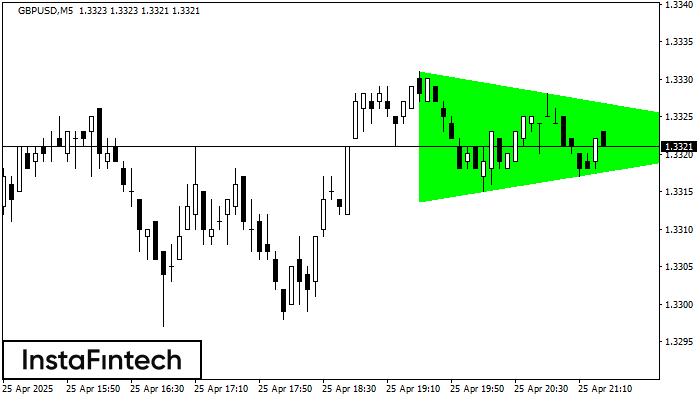
According to the chart of M5, GBPUSD formed the Bullish Symmetrical Triangle pattern, which signals the trend will continue. Description. The upper border of the pattern touches the coordinates 1.3331/1.3322
The M5 and M15 time frames may have more false entry points.
Open chart in a new window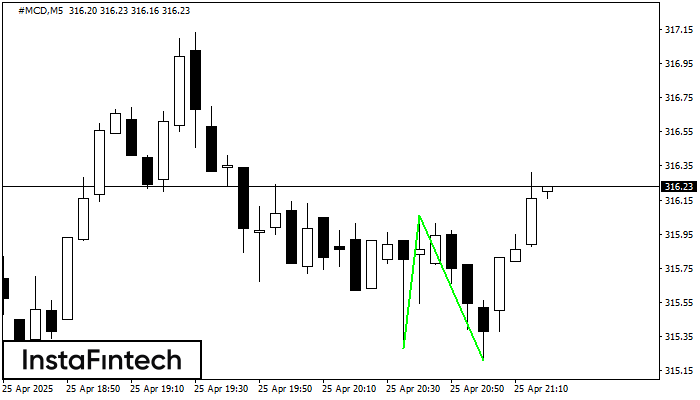
The Double Bottom pattern has been formed on #MCD M5; the upper boundary is 316.06; the lower boundary is 315.21. The width of the pattern is 78 points. In case
The M5 and M15 time frames may have more false entry points.
Open chart in a new window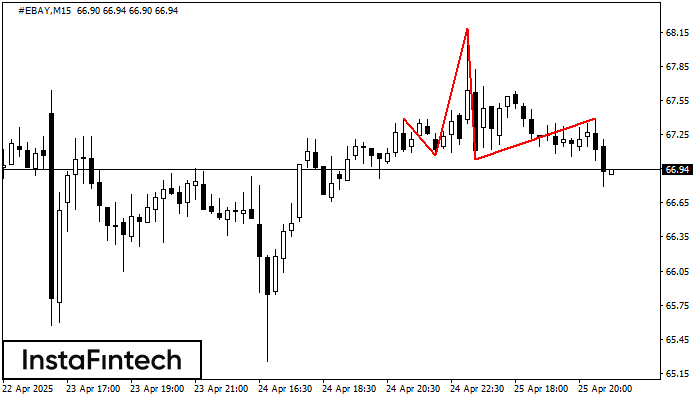
According to the chart of M15, #EBAY formed the Head and Shoulders pattern. The Head’s top is set at 68.18 while the median line of the Neck is found
The M5 and M15 time frames may have more false entry points.
Open chart in a new window


