


signal strength 1 of 5
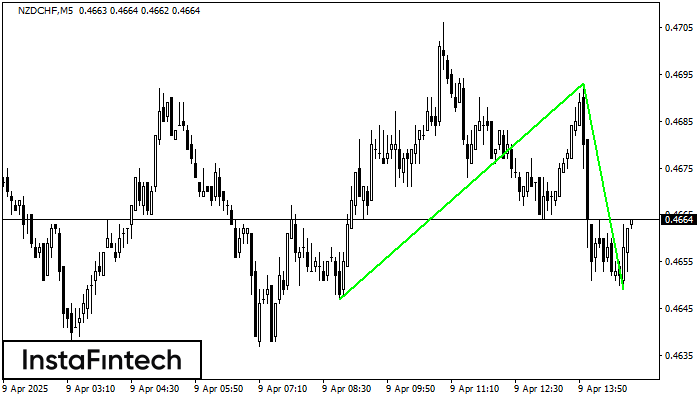
The Double Bottom pattern has been formed on NZDCHF M5. This formation signals a reversal of the trend from downwards to upwards. The signal is that a buy trade should be opened after the upper boundary of the pattern 0.4693 is broken. The further movements will rely on the width of the current pattern 46 points.
The M5 and M15 time frames may have more false entry points.
- All
- Double Top
- Flag
- Head and Shoulders
- Pennant
- Rectangle
- Triangle
- Triple top
- All
- #AAPL
- #AMZN
- #Bitcoin
- #EBAY
- #FB
- #GOOG
- #INTC
- #KO
- #MA
- #MCD
- #MSFT
- #NTDOY
- #PEP
- #TSLA
- #TWTR
- AUDCAD
- AUDCHF
- AUDJPY
- AUDUSD
- EURCAD
- EURCHF
- EURGBP
- EURJPY
- EURNZD
- EURRUB
- EURUSD
- GBPAUD
- GBPCHF
- GBPJPY
- GBPUSD
- GOLD
- NZDCAD
- NZDCHF
- NZDJPY
- NZDUSD
- SILVER
- USDCAD
- USDCHF
- USDJPY
- USDRUB
- All
- M5
- M15
- M30
- H1
- D1
- All
- Buy
- Sale
- All
- 1
- 2
- 3
- 4
- 5
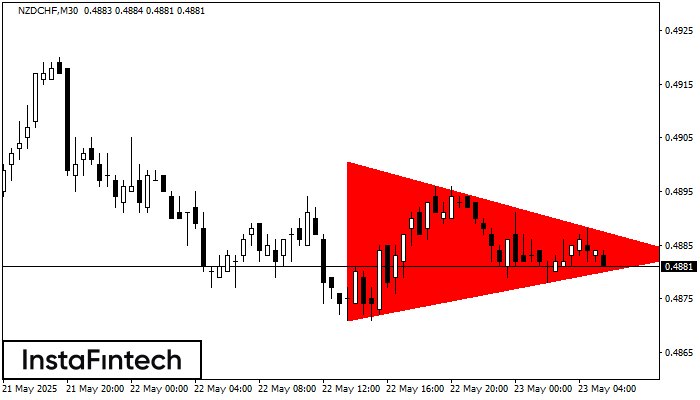
According to the chart of M30, NZDCHF formed the Bearish Symmetrical Triangle pattern. Trading recommendations: A breach of the lower border 0.4871 is likely to encourage a continuation
Open chart in a new window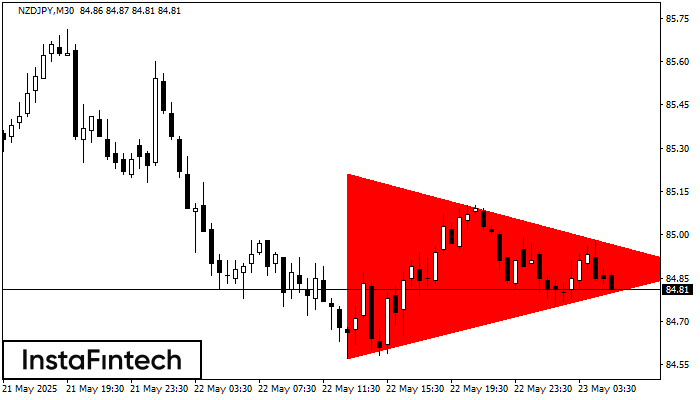
According to the chart of M30, NZDJPY formed the Bearish Symmetrical Triangle pattern. Trading recommendations: A breach of the lower border 84.57 is likely to encourage a continuation
Open chart in a new window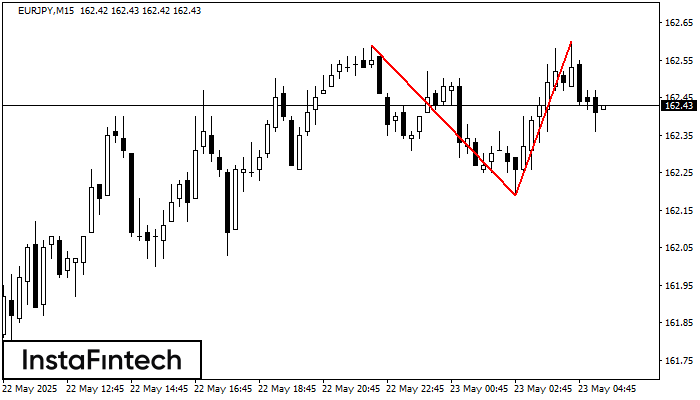
The Double Top reversal pattern has been formed on EURJPY M15. Characteristics: the upper boundary 162.59; the lower boundary 162.19; the width of the pattern is 41 points. Sell trades
The M5 and M15 time frames may have more false entry points.
Open chart in a new window


