empty
07.04.2022 06:50 AM
Trading Signal for Crude Oil (WTI - #CL) for April 07-08, 2021: buy above $95.80 (falling wedge)

This image is no longer relevant

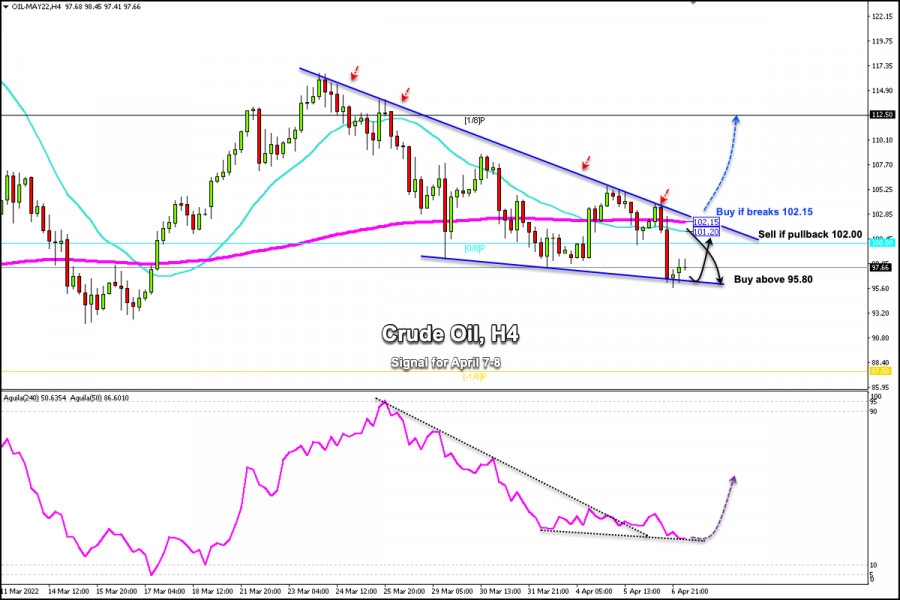
Crude Oil (WTI_#CL) is trading inside a falling wedge technical pattern. Yesterday in the American session, crude fell below the 200 and below the 21 SMA reaching the support of this pattern around 95.60.

We can see a small technical bounce on the 4-hour chart. If it consolidates above the low of 95.74 in the next few hours, we could expect a correction towards the 21 SMA located at 101.20 or towards the 200 EMA around 102.15.

Since March 21, crude has been under downward pressure and has tested several times and failed to break it.

Yesterday, WTI failed to break out of the downtrend channel and made a sharp drop. If the current bounce pushes the price to the area 102.15 and it fails to break it again, then this is an opportunity to sell.

Members of the International Energy Agency (EIA) will release 240 million barrels of crude oil in a bid to cool markets, which is equivalent to about two days of global demand.

On the other hand, if Russia begins to decrease its oil supply globally, the impact could be dramatic and permanent. This deficit combined with low recorded inventories could push oil prices to record highs.

According to the 4-hour chart, we can see that crude oil is in a key support zone which could be a sign of weakness and bearish continuation. However, if WTI consolidates above 95.80, it could be a sign of a technical bounce and the price could reach the area 102.15 in the next few hours.

If in the next hours or days, crude oil breaks the downtrend channel and consolidates above 102.15, we could expect a change in trend and an acceleration of the upward movement so that the price could reach the area 112.50 (1/8 Murray).

Dimitrios Zappas,
Analytical expert of InstaForex
© 2007-2025
选择时间框架
5
分钟
15
分钟
30
分钟
1
小时
4
小时
1
1
通过InstaForex赚取加密货币汇率变动的收益。
下载MetaTrader 4并开启您的第一笔交易。
  • Grand Choice
    Contest by
    InstaForex
    InstaForex always strives to help you
    fulfill your biggest dreams.
    JOIN CONTEST

推荐文章

5月23日美國股市最新情況。市場修正進行中

S&P500 5月23日修正進行中 周四主要美國股市指數快照:道瓊斯 -1.4%,納斯達克 +0.3%,S&P 500 0%,S&P 500 指數在5,842,區間5400–6200。 周四的交易日以不確定的氛圍開始,因為早上眾議院以215–214的黨派投票通過了一項預算措施的和解法案,隨後引發了國債市場的一些緊張情緒。

Jozef Kovach 14:53 2025-05-23 UTC+2

市場接近高峰:最後的衝刺還是新一輪的回調?

投資者越來越感受到基礎的裂縫。本週特朗普政府批准了一項大規模財政方案,承諾減稅和增加軍事支出,這一舉措激發了多頭和悲觀者的情緒。

Anna Zotova 13:05 2025-05-23 UTC+2

S&P 500指數2025年5月23日預測

在日線圖中,價格在上升價格通道的綠色線下方盤整,目標價格水平為5908。這可能表示準備突破阻力位,目標是持續增長,朝價格通道上邊界附近的6318點進發。

Laurie Bailey 05:16 2025-05-23 UTC+2

股票市場買賣推薦 – 2025年5月22日

購買Google股票(#GOOG) Google是Alphabet Holdings旗下的一家跨國公司,專注於互聯網搜尋、雲端運算和廣告技術。 在價格鞏固於165.21水平(2024年11月的低點)之上,以及在平衡線(紅色移動平均線)和簡單55期移動平均線之上後,價格昨日穿破了“全球”MA200(綠色)。

Laurie Bailey 05:06 2025-05-22 UTC+2

美國市場回落。調整即將來臨?

S&P 500 5月21日概覽: 美國市場回調。調整在望? 週二主要美股指數:道瓊 -0.3%,納斯達克 -0.4%,S&P 500 -0.4%。

Jozef Kovach 12:41 2025-05-21 UTC+2

5月20日美國股市更新:市場保持漲幅未出現任何回調

S&P500 5月20日美國股市更新。市場保持上漲,未見任何修正 週一基準美國股指快照:道瓊斯 +0.3%,納斯達克 +0.0%,S&P 500 +0.1%,S&P 500指數報5,963,範圍為5,400–6,200。

Jozef Kovach 11:00 2025-05-20 UTC+2

美國信用評級下調提高市場修正可能性

S&P 500 5月19日概覽 美國信用評級下調增加市場調整可能性 週五美國主要指數:道瓊斯 +0.8%,納斯達克 +0.5%,S&P 500 +0.7% S&P 500:5,958,交易範圍:5,400–6,200 股市在週末收盤時走高。道瓊斯工業平均指數(+0.8%)收盤時較前一交易日上漲超過300點,全年轉為正值(+0.3%)。

Jozef Kovach 12:32 2025-05-19 UTC+2

美國市場:停滯於年度高點之下

S&P 500 5月15日概覽 美國市場:在年度高點以下停滯 週三美國主要指數的表現: 道瓊斯指數 -0.2% | NASDAQ +0.7% | S&P 500 +0.1% S&P 500: 5,892 | 範圍:5,400–6,200 股市收盤漲跌互現。 道瓊斯工業平均指數小幅下跌,納斯達克綜合指數上漲0.7%,標普500指數幾乎持平。

Jozef Kovach 12:59 2025-05-15 UTC+2

2025年5月15日股票市場買賣建議

購買JP Morgan Chase股票 (#JPM) JP Morgan Chase是一家美國跨國金融集團。 在週線圖上,該股票呈現加速上行趨勢,可能目標是達到其價格通道的上邊界。

Laurie Bailey 12:56 2025-05-15 UTC+2

5月14日美國股市更新

S&P500 週二美國基準股指快照: 道瓊指數 -0.6%, 納斯達克指數 +1.6%, S&P 500 指數 +0.7%。 S&P 500:5,886,範圍5,400–6,200。

Jozef Kovach 13:05 2025-05-14 UTC+2
现在无法通话?
提出您的问题,用 在线帮助.
Widget callback