

signal strength 1 of 5

The Bearish pennant pattern has formed on the #AMZN M5 chart. It signals potential continuation of the existing trend. Specifications: the pattern’s bottom has the coordinate of 184.25; the projection of the flagpole height is equal to 866 pips. In case the price breaks out the pattern’s bottom of 184.25, the downtrend is expected to continue for further level 184.10.
The M5 and M15 time frames may have more false entry points.
See Also
- All
- Double Top
- Flag
- Head and Shoulders
- Pennant
- Rectangle
- Triangle
- Triple top
- All
- #AAPL
- #AMZN
- #Bitcoin
- #EBAY
- #FB
- #GOOG
- #INTC
- #KO
- #MA
- #MCD
- #MSFT
- #NTDOY
- #PEP
- #TSLA
- #TWTR
- AUDCAD
- AUDCHF
- AUDJPY
- AUDUSD
- EURCAD
- EURCHF
- EURGBP
- EURJPY
- EURNZD
- EURRUB
- EURUSD
- GBPAUD
- GBPCHF
- GBPJPY
- GBPUSD
- GOLD
- NZDCAD
- NZDCHF
- NZDJPY
- NZDUSD
- SILVER
- USDCAD
- USDCHF
- USDJPY
- USDRUB
- All
- M5
- M15
- M30
- H1
- D1
- All
- Buy
- Sale
- All
- 1
- 2
- 3
- 4
- 5
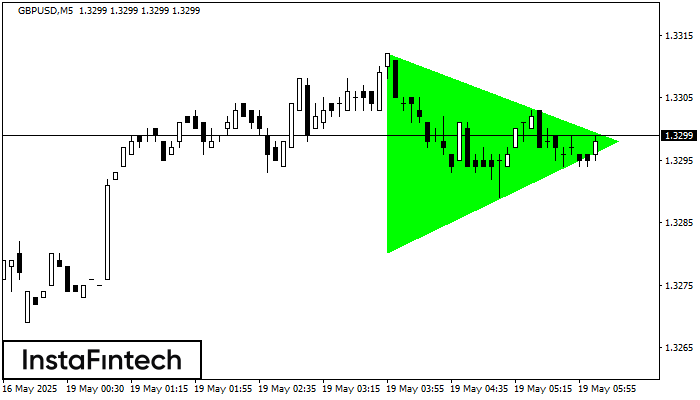
According to the chart of M5, GBPUSD formed the Bullish Symmetrical Triangle pattern. Description: This is the pattern of a trend continuation. 1.3312 and 1.3280 are the coordinates
The M5 and M15 time frames may have more false entry points.
Открыть график инструмента в новом окне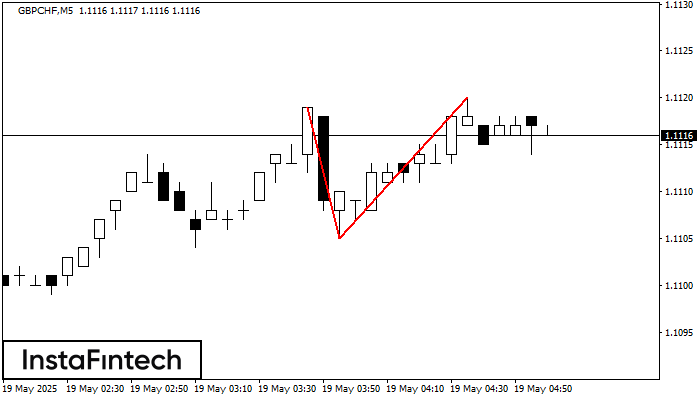
The Double Top reversal pattern has been formed on GBPCHF M5. Characteristics: the upper boundary 1.1119; the lower boundary 1.1105; the width of the pattern is 15 points. Sell trades
The M5 and M15 time frames may have more false entry points.
Открыть график инструмента в новом окне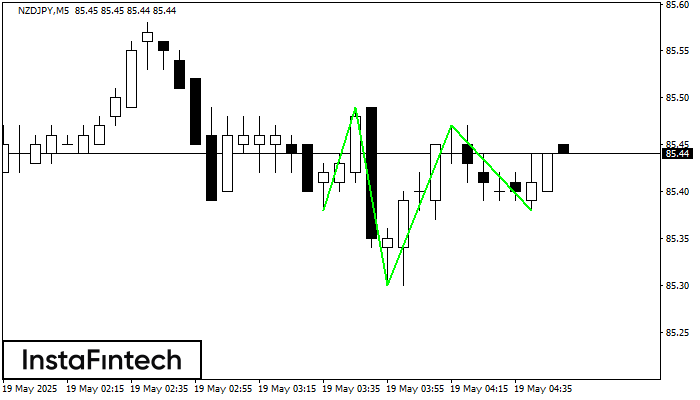
According to M5, NZDJPY is shaping the technical pattern – the Inverse Head and Shoulder. In case the Neckline 85.49/85.47 is broken out, the instrument is likely to move toward
The M5 and M15 time frames may have more false entry points.
Открыть график инструмента в новом окне


