

signal strength 2 of 5

According to the chart of M15, #INTC formed the Bearish Symmetrical Triangle pattern. Description: The lower border is 18.56/19.63 and upper border is 20.82/19.63. The pattern width is measured on the chart at -226 pips. The formation of the Bearish Symmetrical Triangle pattern evidently signals a continuation of the downward trend. In other words, if the scenario comes true and #INTC breaches the lower border, the price could continue its move toward 19.41.
The M5 and M15 time frames may have more false entry points.
- All
- Double Top
- Flag
- Head and Shoulders
- Pennant
- Rectangle
- Triangle
- Triple top
- All
- #AAPL
- #AMZN
- #Bitcoin
- #EBAY
- #FB
- #GOOG
- #INTC
- #KO
- #MA
- #MCD
- #MSFT
- #NTDOY
- #PEP
- #TSLA
- #TWTR
- AUDCAD
- AUDCHF
- AUDJPY
- AUDUSD
- EURCAD
- EURCHF
- EURGBP
- EURJPY
- EURNZD
- EURRUB
- EURUSD
- GBPAUD
- GBPCHF
- GBPJPY
- GBPUSD
- GOLD
- NZDCAD
- NZDCHF
- NZDJPY
- NZDUSD
- SILVER
- USDCAD
- USDCHF
- USDJPY
- USDRUB
- All
- M5
- M15
- M30
- H1
- D1
- All
- Buy
- Sale
- All
- 1
- 2
- 3
- 4
- 5
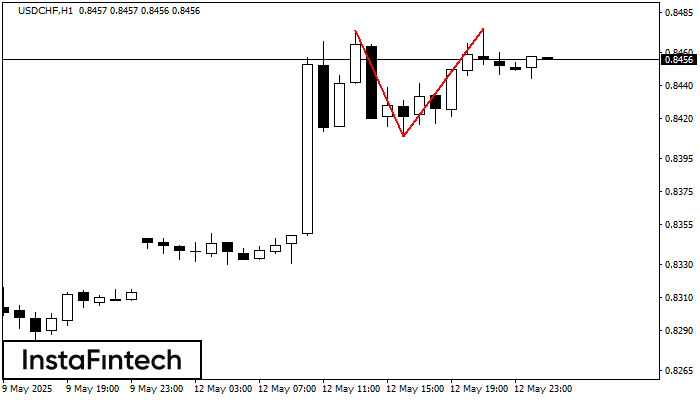
По USDCHF на H1 сформировалась разворотная фигура «Двойная вершина». Характеристика: Верхняя граница 0.8474; Нижняя граница 0.8409; Ширина фигуры 66 пунктов. Позицию на продажу возможно открыть ниже нижней границы 0.8409
Открыть график инструмента в новом окне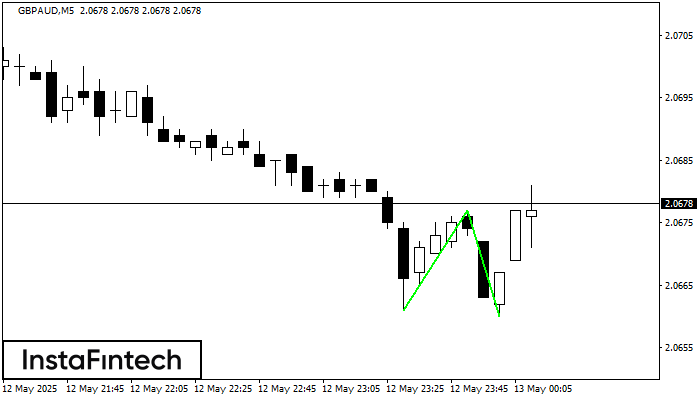
Сформирована фигура «Двойное дно» на графике GBPAUD M5. Верхняя граница 2.0677; Нижняя граница 2.0660; Ширина фигуры 16 пунктов. В случае пробоя верхней границы 2.0677 можно будет прогнозировать изменение тенденции
Таймфреймы М5 и М15 могут иметь больше ложных точек входа.
Открыть график инструмента в новом окне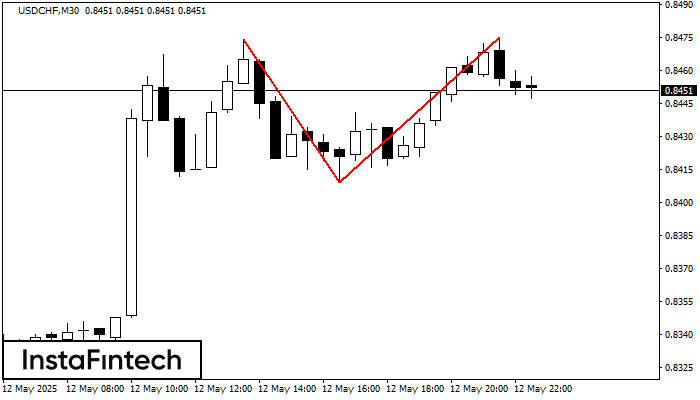
На торговом графике USDCHF M30 сформировалась разворотная фигура «Двойная вершина». Характеристика: Верхняя граница 0.8475; Нижняя граница 0.8409; Ширина фигуры 66 пунктов. Сигнал: Пробой нижней границы 0.8409 приведет к дальнейшему нисходящему
Открыть график инструмента в новом окне


