


signal strength 1 of 5
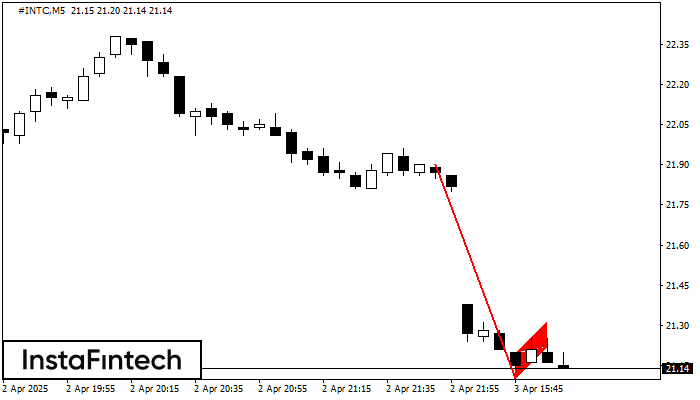
The Bearish Flag pattern has been formed on #INTC at M5. The lower boundary of the pattern is located at 21.10/21.22 while the upper boundary lies at 21.20/21.32. The projection of the flagpole is 80 points. This formation signals that the downward trend is most likely to continue. Therefore, if the level of 21.10 is broken, the price will move further downwards.
The M5 and M15 time frames may have more false entry points.
- All
- Double Top
- Flag
- Head and Shoulders
- Pennant
- Rectangle
- Triangle
- Triple top
- All
- #AAPL
- #AMZN
- #Bitcoin
- #EBAY
- #FB
- #GOOG
- #INTC
- #KO
- #MA
- #MCD
- #MSFT
- #NTDOY
- #PEP
- #TSLA
- #TWTR
- AUDCAD
- AUDCHF
- AUDJPY
- AUDUSD
- EURCAD
- EURCHF
- EURGBP
- EURJPY
- EURNZD
- EURRUB
- EURUSD
- GBPAUD
- GBPCHF
- GBPJPY
- GBPUSD
- GOLD
- NZDCAD
- NZDCHF
- NZDJPY
- NZDUSD
- SILVER
- USDCAD
- USDCHF
- USDJPY
- USDRUB
- All
- M5
- M15
- M30
- H1
- D1
- All
- Buy
- Sale
- All
- 1
- 2
- 3
- 4
- 5
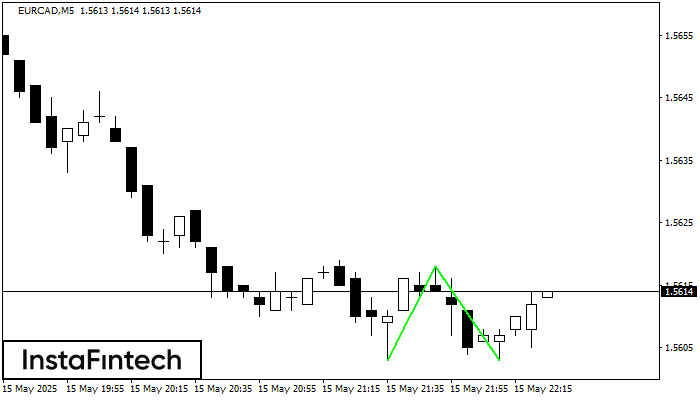
The Double Bottom pattern has been formed on EURCAD M5; the upper boundary is 1.5618; the lower boundary is 1.5603. The width of the pattern is 15 points. In case
The M5 and M15 time frames may have more false entry points.
Open chart in a new window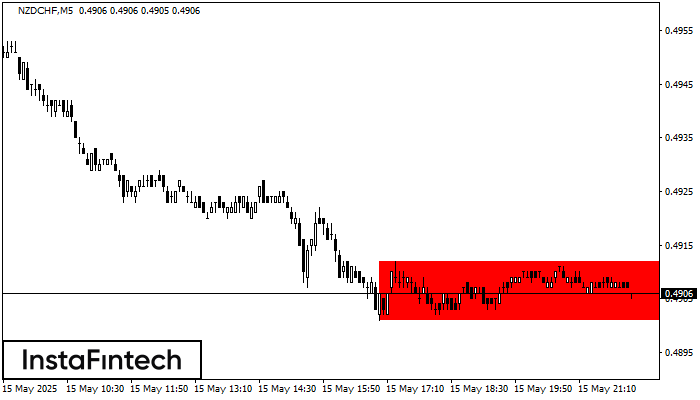
According to the chart of M5, NZDCHF formed the Bearish Rectangle which is a pattern of a trend continuation. The pattern is contained within the following borders: lower border 0.4901
The M5 and M15 time frames may have more false entry points.
Open chart in a new window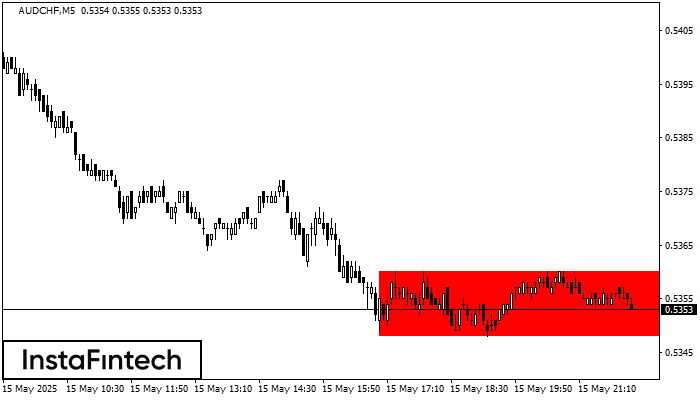
According to the chart of M5, AUDCHF formed the Bearish Rectangle. The pattern indicates a trend continuation. The upper border is 0.5360, the lower border is 0.5348. The signal means
The M5 and M15 time frames may have more false entry points.
Open chart in a new window


