


signal strength 1 of 5

The EURCAD M5 formed the Head and Shoulders pattern with the following features: The Head’s top is at 1.5734, the Neckline and the upward angle are at 1.5652/1.5644. The formation of this pattern can bring about changes in the current trend from bullish to bearish. In case the pattern triggers the expected changes, the price of EURCAD will go towards 1.5629.
The M5 and M15 time frames may have more false entry points.
- All
- Double Top
- Flag
- Head and Shoulders
- Pennant
- Rectangle
- Triangle
- Triple top
- All
- #AAPL
- #AMZN
- #Bitcoin
- #EBAY
- #FB
- #GOOG
- #INTC
- #KO
- #MA
- #MCD
- #MSFT
- #NTDOY
- #PEP
- #TSLA
- #TWTR
- AUDCAD
- AUDCHF
- AUDJPY
- AUDUSD
- EURCAD
- EURCHF
- EURGBP
- EURJPY
- EURNZD
- EURRUB
- EURUSD
- GBPAUD
- GBPCHF
- GBPJPY
- GBPUSD
- GOLD
- NZDCAD
- NZDCHF
- NZDJPY
- NZDUSD
- SILVER
- USDCAD
- USDCHF
- USDJPY
- USDRUB
- All
- M5
- M15
- M30
- H1
- D1
- All
- Buy
- Sale
- All
- 1
- 2
- 3
- 4
- 5
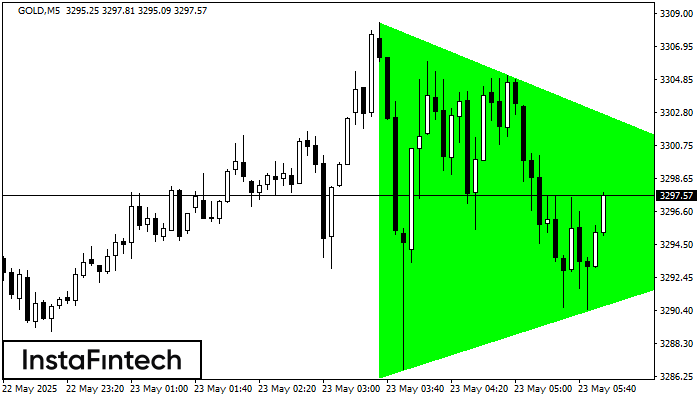
According to the chart of M5, GOLD formed the Bullish Symmetrical Triangle pattern. The lower border of the pattern touches the coordinates 3286.21/3295.95 whereas the upper border goes across 3308.46/3295.95
The M5 and M15 time frames may have more false entry points.
Open chart in a new window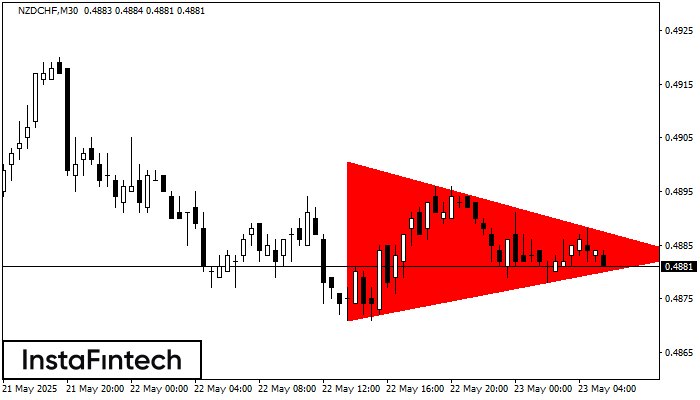
According to the chart of M30, NZDCHF formed the Bearish Symmetrical Triangle pattern. Trading recommendations: A breach of the lower border 0.4871 is likely to encourage a continuation
Open chart in a new window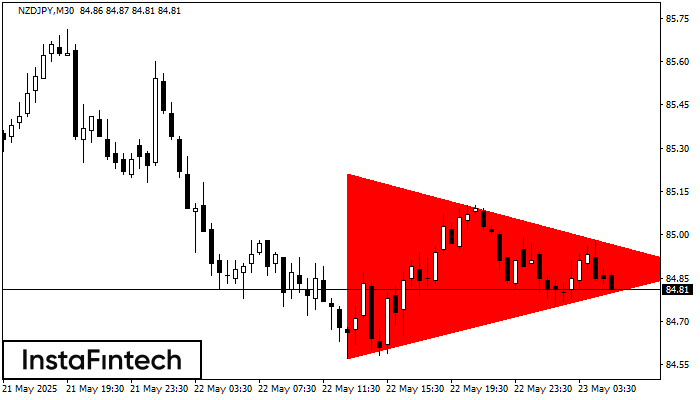
According to the chart of M30, NZDJPY formed the Bearish Symmetrical Triangle pattern. Trading recommendations: A breach of the lower border 84.57 is likely to encourage a continuation
Open chart in a new window


