

signal strength 2 of 5
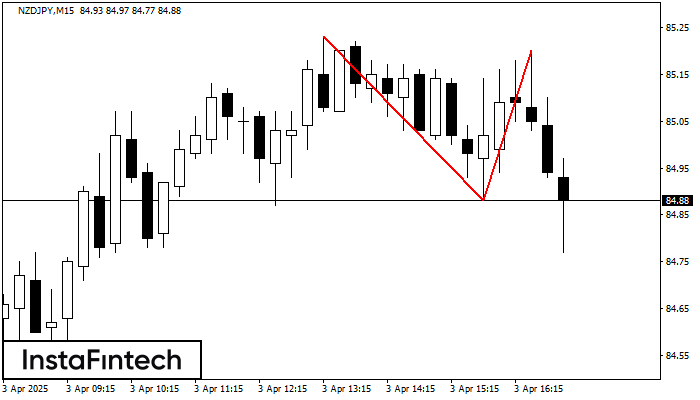
The Double Top pattern has been formed on NZDJPY M15. It signals that the trend has been changed from upwards to downwards. Probably, if the base of the pattern 84.88 is broken, the downward movement will continue.
The M5 and M15 time frames may have more false entry points.
See Also
- All
- Double Top
- Flag
- Head and Shoulders
- Pennant
- Rectangle
- Triangle
- Triple top
- All
- #AAPL
- #AMZN
- #Bitcoin
- #EBAY
- #FB
- #GOOG
- #INTC
- #KO
- #MA
- #MCD
- #MSFT
- #NTDOY
- #PEP
- #TSLA
- #TWTR
- AUDCAD
- AUDCHF
- AUDJPY
- AUDUSD
- EURCAD
- EURCHF
- EURGBP
- EURJPY
- EURNZD
- EURRUB
- EURUSD
- GBPAUD
- GBPCHF
- GBPJPY
- GBPUSD
- GOLD
- NZDCAD
- NZDCHF
- NZDJPY
- NZDUSD
- SILVER
- USDCAD
- USDCHF
- USDJPY
- USDRUB
- All
- M5
- M15
- M30
- H1
- D1
- All
- Buy
- Sale
- All
- 1
- 2
- 3
- 4
- 5

According to the chart of M5, GOLD formed the Bearish Symmetrical Triangle pattern. Description: The lower border is 3314.14/3331.45 and upper border is 3343.45/3331.45. The pattern width is measured
The M5 and M15 time frames may have more false entry points.
Open chart in a new window
The Triple Bottom pattern has formed on the chart of EURUSD H1. Features of the pattern: The lower line of the pattern has coordinates 1.1439 with the upper limit 1.1439/1.1357
Open chart in a new window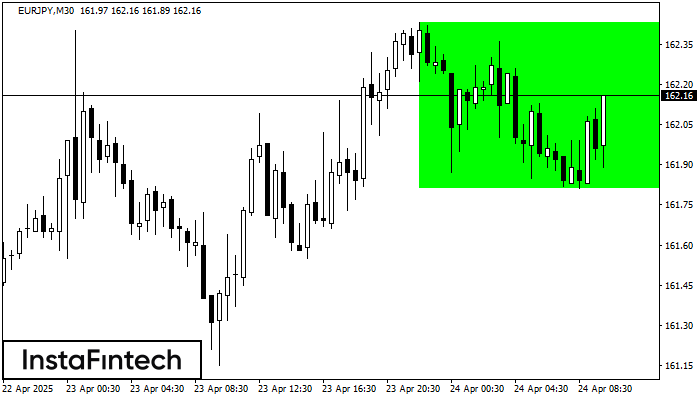
According to the chart of M30, EURJPY formed the Bullish Rectangle. The pattern indicates a trend continuation. The upper border is 162.43, the lower border is 161.81. The signal means
Open chart in a new window


