


signal strength 2 of 5
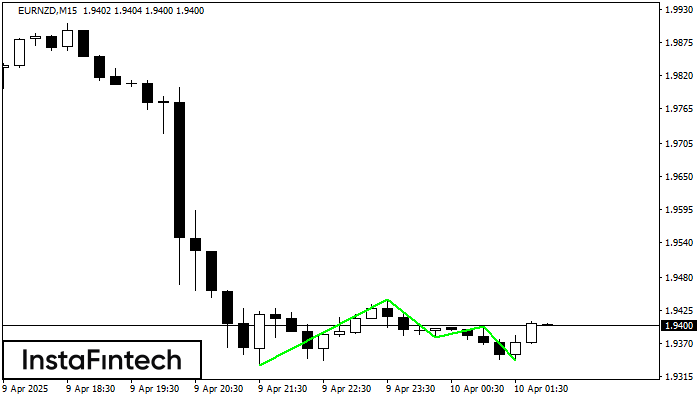
The Triple Bottom pattern has formed on the chart of EURNZD M15. Features of the pattern: The lower line of the pattern has coordinates 1.9443 with the upper limit 1.9443/1.9398, the projection of the width is 110 points. The formation of the Triple Bottom pattern most likely indicates a change in the trend from downward to upward. This means that in the event of a breakdown of the resistance level 1.9333, the price is most likely to continue the upward movement.
The M5 and M15 time frames may have more false entry points.
- All
- Double Top
- Flag
- Head and Shoulders
- Pennant
- Rectangle
- Triangle
- Triple top
- All
- #AAPL
- #AMZN
- #Bitcoin
- #EBAY
- #FB
- #GOOG
- #INTC
- #KO
- #MA
- #MCD
- #MSFT
- #NTDOY
- #PEP
- #TSLA
- #TWTR
- AUDCAD
- AUDCHF
- AUDJPY
- AUDUSD
- EURCAD
- EURCHF
- EURGBP
- EURJPY
- EURNZD
- EURRUB
- EURUSD
- GBPAUD
- GBPCHF
- GBPJPY
- GBPUSD
- GOLD
- NZDCAD
- NZDCHF
- NZDJPY
- NZDUSD
- SILVER
- USDCAD
- USDCHF
- USDJPY
- USDRUB
- All
- M5
- M15
- M30
- H1
- D1
- All
- Buy
- Sale
- All
- 1
- 2
- 3
- 4
- 5
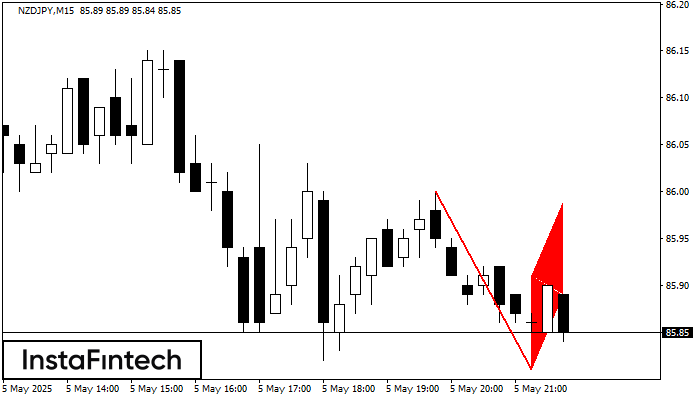
The Bearish Flag pattern has been formed on the chart NZDJPY M15. Therefore, the downwards trend is likely to continue in the nearest term. As soon as the price breaks
The M5 and M15 time frames may have more false entry points.
Open chart in a new window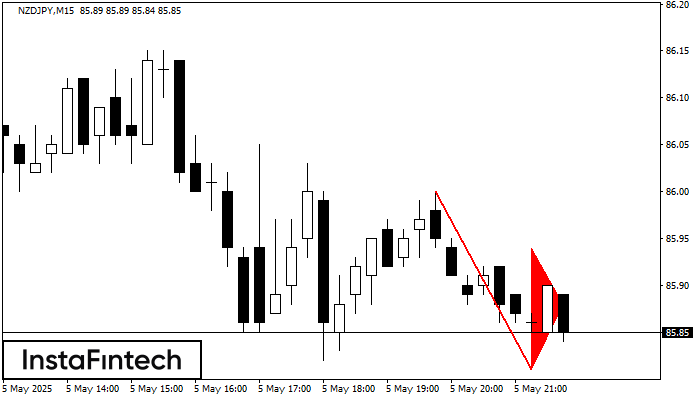
The Bearish pennant pattern has formed on the NZDJPY M15 chart. It signals potential continuation of the existing trend. Specifications: the pattern’s bottom has the coordinate of 85.81; the projection
The M5 and M15 time frames may have more false entry points.
Open chart in a new window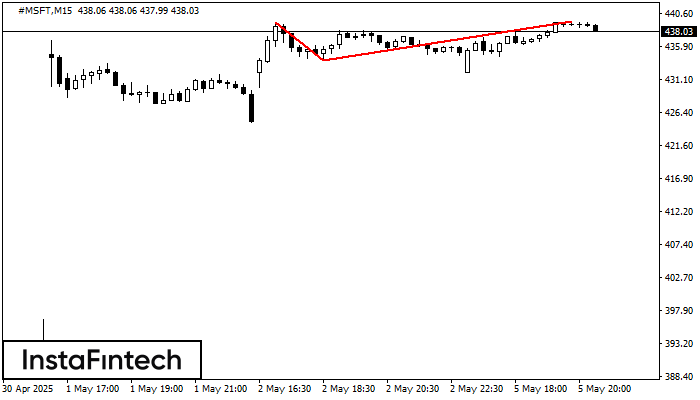
The Double Top pattern has been formed on #MSFT M15. It signals that the trend has been changed from upwards to downwards. Probably, if the base of the pattern 433.94
The M5 and M15 time frames may have more false entry points.
Open chart in a new window


