


signal strength 1 of 5
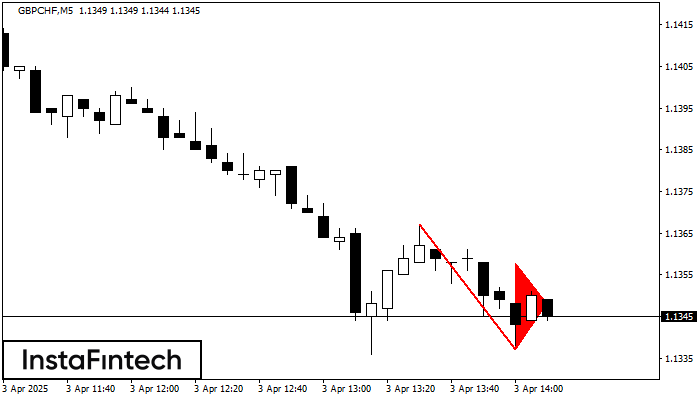
The Bearish pennant pattern has formed on the GBPCHF M5 chart. The pattern signals continuation of the downtrend in case the pennant’s low of 1.1337 is broken through. Recommendations: Place the sell stop pending order 10 pips below the pattern’s low. Place the take profit order at the projection distance of the flagpole height.
The M5 and M15 time frames may have more false entry points.
- All
- Double Top
- Flag
- Head and Shoulders
- Pennant
- Rectangle
- Triangle
- Triple top
- All
- #AAPL
- #AMZN
- #Bitcoin
- #EBAY
- #FB
- #GOOG
- #INTC
- #KO
- #MA
- #MCD
- #MSFT
- #NTDOY
- #PEP
- #TSLA
- #TWTR
- AUDCAD
- AUDCHF
- AUDJPY
- AUDUSD
- EURCAD
- EURCHF
- EURGBP
- EURJPY
- EURNZD
- EURRUB
- EURUSD
- GBPAUD
- GBPCHF
- GBPJPY
- GBPUSD
- GOLD
- NZDCAD
- NZDCHF
- NZDJPY
- NZDUSD
- SILVER
- USDCAD
- USDCHF
- USDJPY
- USDRUB
- All
- M5
- M15
- M30
- H1
- D1
- All
- Buy
- Sale
- All
- 1
- 2
- 3
- 4
- 5

M5 के चार्ट के अनुसार, #Bitcoin से इन्वर्स हेड एण्ड शोल्डर्स पैटर्न बना। हेड 102549.85 पर स्थित है जबकि नेक की मध्य रेखा 103359.60/103319.80 पर सेट है। इन्वर्स हेड एण्ड
M5 और M15 समय सीमा में अधिक फाल्स एंट्री पॉइंट्स हो सकते हैं।
Open chart in a new window
डबल बॉटम पैटर्न #Bitcoin M5 पर बना है; ऊपरी सीमा 103642.04 है; निचली सीमा 103357.83 है। पैटर्न की चौड़ाई 27887 अंक है। ऊपरी सीमा 103642.04 के टूटने के मामले में
M5 और M15 समय सीमा में अधिक फाल्स एंट्री पॉइंट्स हो सकते हैं।
Open chart in a new window
डबल बॉटम पैटर्न #Bitcoin M5 पर बना है। विशेषताएं: समर्थन स्तर 103472.45; प्रतिरोध स्तर 103745.49; पैटर्न की चौड़ाई 27304 पॉइंट्स। यदि प्रतिरोध स्तर टूट जाता है, तो रुझान में बदलाव
M5 और M15 समय सीमा में अधिक फाल्स एंट्री पॉइंट्स हो सकते हैं।
Open chart in a new window


