

signal strength 1 of 5
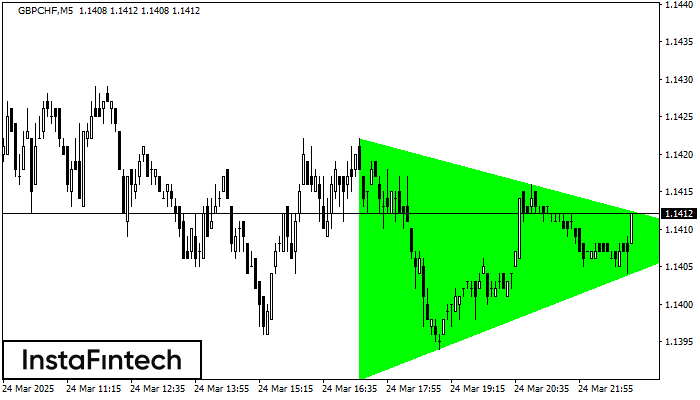
According to the chart of M5, GBPCHF formed the Bullish Symmetrical Triangle pattern. Description: This is the pattern of a trend continuation. 1.1422 and 1.1390 are the coordinates of the upper and lower borders respectively. The pattern width is measured on the chart at 32 pips. Outlook: If the upper border 1.1422 is broken, the price is likely to continue its move by 1.1424.
The M5 and M15 time frames may have more false entry points.
See Also
- All
- Double Top
- Flag
- Head and Shoulders
- Pennant
- Rectangle
- Triangle
- Triple top
- All
- #AAPL
- #AMZN
- #Bitcoin
- #EBAY
- #FB
- #GOOG
- #INTC
- #KO
- #MA
- #MCD
- #MSFT
- #NTDOY
- #PEP
- #TSLA
- #TWTR
- AUDCAD
- AUDCHF
- AUDJPY
- AUDUSD
- EURCAD
- EURCHF
- EURGBP
- EURJPY
- EURNZD
- EURRUB
- EURUSD
- GBPAUD
- GBPCHF
- GBPJPY
- GBPUSD
- GOLD
- NZDCAD
- NZDCHF
- NZDJPY
- NZDUSD
- SILVER
- USDCAD
- USDCHF
- USDJPY
- USDRUB
- All
- M5
- M15
- M30
- H1
- D1
- All
- Buy
- Sale
- All
- 1
- 2
- 3
- 4
- 5
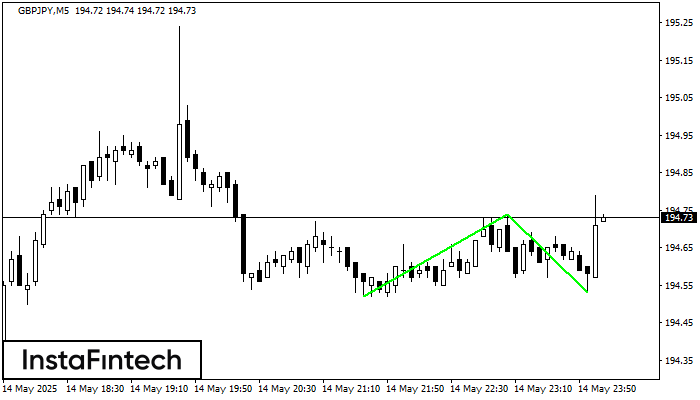
Сформирована фигура «Двойное дно» на графике GBPJPY M5. Верхняя граница 194.74; Нижняя граница 194.53; Ширина фигуры 22 пунктов. В случае пробоя верхней границы 194.74 можно будет прогнозировать изменение тенденции
Таймфреймы М5 и М15 могут иметь больше ложных точек входа.
Открыть график инструмента в новом окне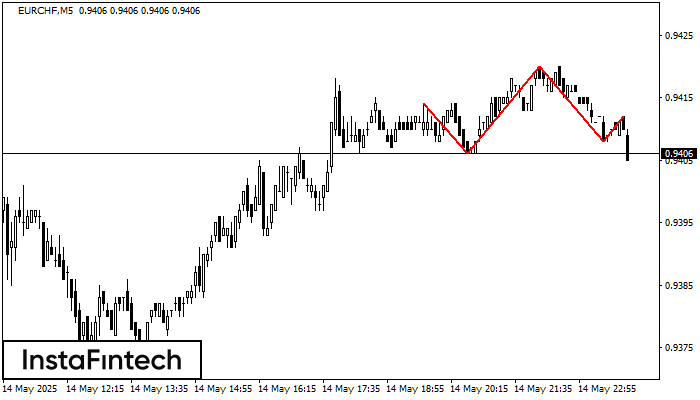
По EURCHF на M5 сформировалась фигура «Голова и плечи». Вершина головы закреплена на 0.9420, при этом средняя линия шеи расположена на 0.9406/0.9408. Формирование фигуры «Голова и плечи» наиболее вероятным образом
Таймфреймы М5 и М15 могут иметь больше ложных точек входа.
Открыть график инструмента в новом окне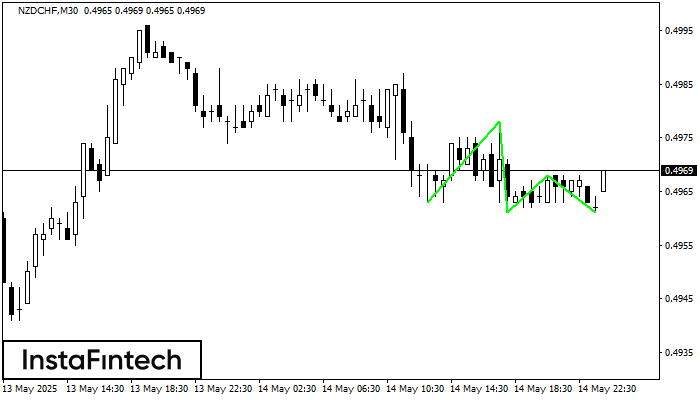
По NZDCHF на M30 сформировалась фигура «Тройное дно». Характеристика: Нижняя граница фигуры имеет координаты 0.4961, при этом верхняя граница 0.4978/0.4968. Проекция ширины 17 пунктов. Формирование фигуры «Тройное дно» наиболее вероятным
Открыть график инструмента в новом окне


