

signal strength 2 of 5
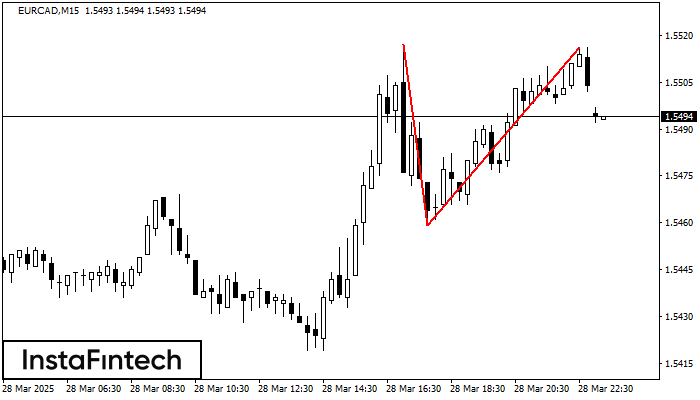
The Double Top pattern has been formed on EURCAD M15. It signals that the trend has been changed from upwards to downwards. Probably, if the base of the pattern 1.5459 is broken, the downward movement will continue.
The M5 and M15 time frames may have more false entry points.
See Also
- All
- Double Top
- Flag
- Head and Shoulders
- Pennant
- Rectangle
- Triangle
- Triple top
- All
- #AAPL
- #AMZN
- #Bitcoin
- #EBAY
- #FB
- #GOOG
- #INTC
- #KO
- #MA
- #MCD
- #MSFT
- #NTDOY
- #PEP
- #TSLA
- #TWTR
- AUDCAD
- AUDCHF
- AUDJPY
- AUDUSD
- EURCAD
- EURCHF
- EURGBP
- EURJPY
- EURNZD
- EURRUB
- EURUSD
- GBPAUD
- GBPCHF
- GBPJPY
- GBPUSD
- GOLD
- NZDCAD
- NZDCHF
- NZDJPY
- NZDUSD
- SILVER
- USDCAD
- USDCHF
- USDJPY
- USDRUB
- All
- M5
- M15
- M30
- H1
- D1
- All
- Buy
- Sale
- All
- 1
- 2
- 3
- 4
- 5
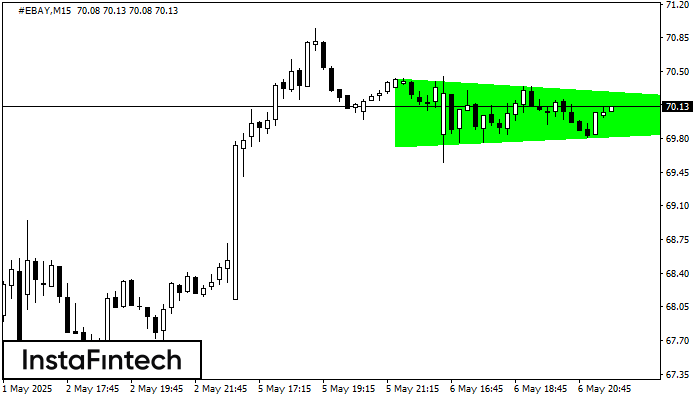
According to the chart of M15, #EBAY formed the Bullish Symmetrical Triangle pattern. The lower border of the pattern touches the coordinates 69.72/70.02 whereas the upper border goes across 70.42/70.02
The M5 and M15 time frames may have more false entry points.
Open chart in a new window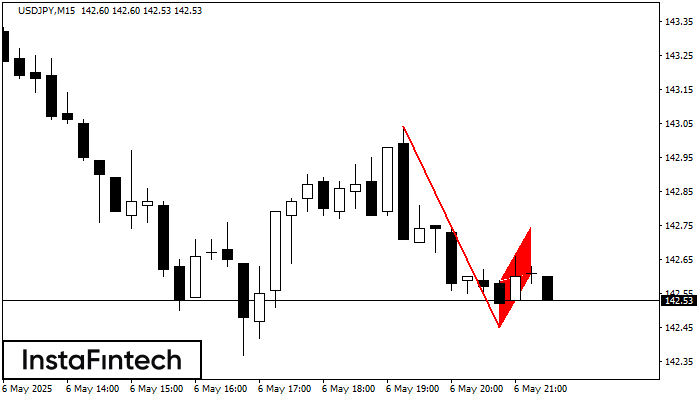
The Bearish Flag pattern has been formed on USDJPY at M15. The lower boundary of the pattern is located at 142.45/142.61 while the upper boundary lies at 142.59/142.75. The projection
The M5 and M15 time frames may have more false entry points.
Open chart in a new window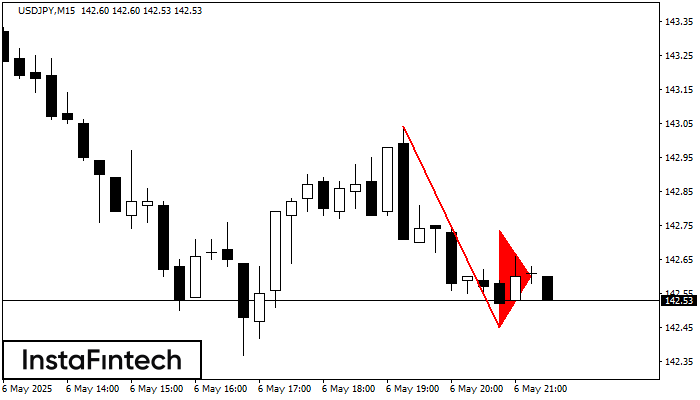
The Bearish pennant pattern has formed on the USDJPY M15 chart. The pattern signals continuation of the downtrend in case the pennant’s low of 142.45 is broken through. Recommendations: Place
The M5 and M15 time frames may have more false entry points.
Open chart in a new window


