empty
21.08.2024 12:54 PM
GBP/USD. August 21. The Pound Exceeds Expectations by a Wide Margin

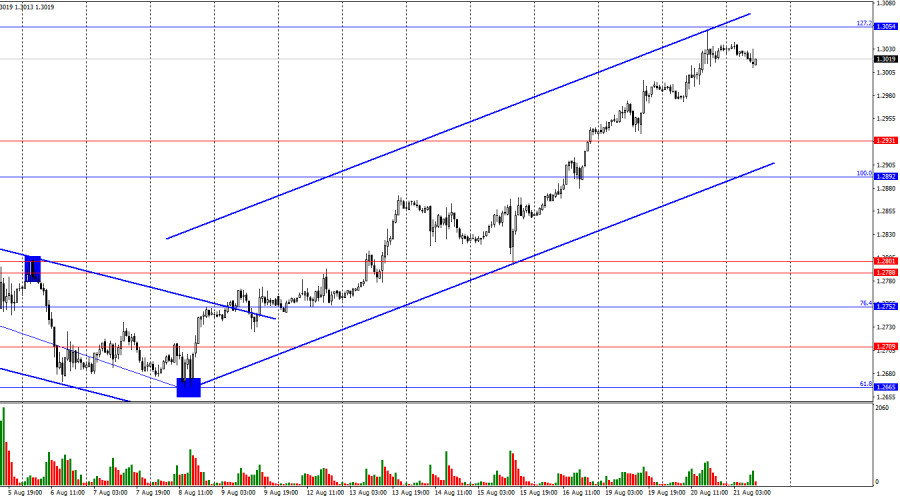
On the hourly chart, the GBP/USD pair continued its upward movement on Tuesday after consolidating above the 1.2931 level. Last evening, the quotes stopped just a few points short of the 127.2% corrective level at 1.3054. This can be considered a rebound, which may indicate a potential reversal in favor of the U.S. dollar and a possible decline towards the 1.2931 level. The upward trend channel allows for such a correction. Consolidating the quotes above the 1.3054 level will increase the likelihood of continued growth toward the next Fibonacci level at 161.8% – 1.3258.

This image is no longer relevant

The wave pattern is clear. The last completed downward wave failed to break the low of the previous wave, while the last upward wave managed to break the previous high by just a few points. Thus, we are currently dealing with a "bullish" trend, but the waves are so large that any trend change might be detected too late. To be confident in the continuation of the "bullish" trend, a firm close above the 1.3054 level is required.

There was no significant news on Tuesday, and today traders are only awaiting the FOMC minutes. The minutes will be released late in the evening and are unlikely to trigger new bullish attacks, as they typically do not contain crucial information. However, the last meeting of the regulator might have included discussions on the need to start easing monetary policy soon. If the minutes reflect an increase in dovish sentiment within the Fed, this could give the dollar another reason to continue its decline. Nevertheless, I expect at least a slight pullback in the pair's value. A corrective wave needs to form, indicators need to be reset, divergences cleared, and Jerome Powell's speech on Friday has already been priced in by the market. I did not see strong reasons for the pair to continue rising on Monday, and there are even fewer reasons on Wednesday, in my opinion.

This image is no longer relevant

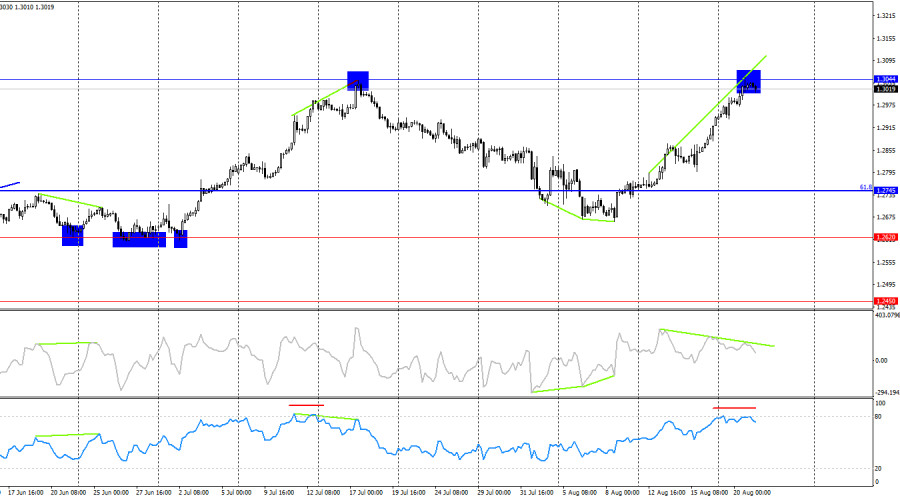
On the 4-hour chart, the pair has risen to the 1.3044 level. A rebound from this level could indicate a reversal in favor of the U.S. dollar and some decline. Besides the rebound, the CCI indicator has been signaling a bearish divergence for a week, and the RSI indicator is in overbought territory, which is rare. Therefore, I would say that the likelihood of the pair declining in the coming days is high. Consolidation above the 1.3044 level will increase the chances of continued growth toward the next Fibonacci level at 76.4% – 1.3314.

Commitments of Traders (COT) Report:

This image is no longer relevant

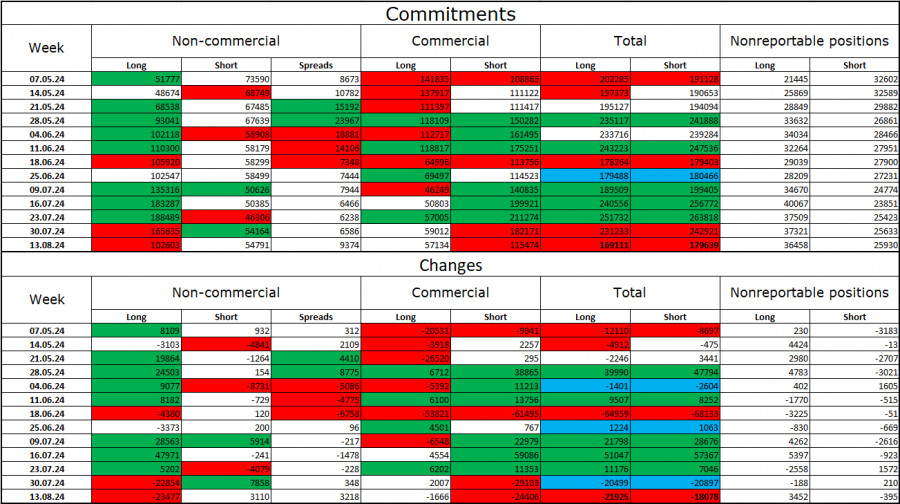
The sentiment of the Non-commercial category of traders has become much less bullish in the last reporting week. The number of long positions held by speculators decreased by 23,477, while the number of short positions increased by 3,110. Bulls still hold a significant advantage. The gap between the number of long and short positions is nearly 50,000, with 102,000 long positions versus 55,000 short positions.

In my view, the pound still faces the prospect of declining, but COT reports suggest otherwise. Over the past three months, the number of long positions has increased from 51,000 to 102,000, while the number of short positions has decreased from 74,000 to 55,000. I believe that over time, professional players will start to offload long positions or increase short positions, as all potential buying factors for the British pound have already been priced in. However, it is important to remember that this is just an assumption. Technical analysis indicates a likely decline in the near future, but that does not mean the decline will last for several months or half a year.

News Calendar for the U.S. and the U.K.:

U.S. – Release of FOMC Minutes (18:00 UTC).

On Wednesday, the economic event calendar contains only one entry. The influence of the news on market sentiment today will be very weak and only in the evening.

Forecast for GBP/USD and Trading Advice:

Selling the pair is possible today on a rebound from the 1.3044 level on the 4-hour chart with targets at 1.2931 and 1.2892. I would not consider new purchases at the moment, but a close above the 1.3044 level would open new horizons for the bulls.

Fibonacci levels are plotted between 1.2892–1.2298 on the hourly chart and between 1.4248–1.0404 on the 4-hour chart.

Pilih carta masa
5
min
15
min
30
min
1
jam
4
jam
1
hari
1
minggu
Jana pendapatan melalui perubahan kadar mata wang kripto dengan InstaForex.
Muat turun MetaTrader 4 dan buka dagangan pertama anda.
  • Grand Choice
    Contest by
    InstaForex
    InstaForex always strives to help you
    fulfill your biggest dreams.
    SERTAI PERADUAN

Artikel yang dicadangkan

Ramalan EUR/USD untuk 23 Mei 2025

Data PMI Zon Euro bagi bulan Mei yang diterbitkan semalam mengecewakan. PMI Pembuatan menurun daripada 49.0 kepada 48.4 (berbanding jangkaan 49.2), manakala PMI Perkhidmatan merosot daripada 50.1 kepada 48.9 (berbanding

Laurie Bailey 05:16 2025-05-23 UTC+2

Ramalan GBP/USD untuk 23 Mei 2025

Semalam, mata wang pound British ditutup pada tahap pembukaannya, yang kelihatan secara teknikal sebagai fasa pengukuhan di bawah tahap 1.3433 — tahap yang sedang diusahakan untuk ditembusi oleh harga dalam

Laurie Bailey 04:48 2025-05-23 UTC+2

Ramalan EUR/NZD untuk 23 Mei 2025

Pada carta harian, sebut harga pasangan ini menembusi di atas garisan MACD selepas berada di bawahnya selama dua minggu. Kemasukan pengayun Marlin ke dalam kawasan positif menyokong andaian tentang pembalikan

Laurie Bailey 04:43 2025-05-23 UTC+2

Isyarat Dagangan untuk EMAS bagi 22-25 Mei 2025: beli di atas $3,281 (21 SMA - 6/8 Murray)

Penunjuk Eagle sedang menunjukkan isyarat negatif, mencadangkan bahawa penurunan harga emas boleh berterusan dalam beberapa hari akan datang. Untuk memantau perkara ini, kita mesti memberi perhatian kepada zon 3,281;

Dimitrios Zappas 18:15 2025-05-22 UTC+2

Isyarat Dagangan BITCOIN untuk 22-25 Mei 2025: jual di bawah $111,850 (+2/8 Murray - 200 EMA)

Bitcoin telah mencapai paras tertinggi melebihi $111,850 berhampiran kawasan +2/8 Murray, yang mewakili zon terlebih beli yang melampau. Bitcoin berkemungkinan mengalami penurunan mendadak dalam beberapa hari akan datang dan boleh

Dimitrios Zappas 18:12 2025-05-22 UTC+2

Isyarat Dagangan untuk EUR/USD bagi 22-25 Mei, 2025: jual di bawah 1.1286 (200 EMA - 21 SMA)

EUR/USD didagangkan sekitar 1.1287 selepas berusaha untuk menembusi bahagian atas saluran aliran menurun. Instrumen ini kini mengukuh sekitar 21 SMA, yang menunjukkan ia boleh meneruskan kejatuhannya dalam beberapa hari akan

Dimitrios Zappas 18:11 2025-05-22 UTC+2

Ramalan untuk EUR/USD pada 22 Mei 2025

Pada hari Rabu, pasangan EUR/USD terus meningkat dan mengukuh di atas tahap anjakan semula Fibonacci 50.0% pada 1.1320. Akibatnya, euro boleh terus menguat ke arah zon rintangan seterusnya iaitu 1.1374–1.1380

Samir Klishi 11:51 2025-05-22 UTC+2

Ramalan GBP/USD pada 22 Mei 2025

Pada carta sejam, pasangan GBP/USD terus meningkat pada hari Rabu, menamatkan hari di sekitar tahap 1.3425. Hanya beberapa minggu lalu, tiada tanda penjualan dolar seterusnya, tetapi keyakinan pedagang terhadap perjanjian

Samir Klishi 11:45 2025-05-22 UTC+2

Bitcoin: Pencapaian Paras Tertinggi Baharu Mungkin Terhenti

Harga Bitcoin secara ringkas melepasi paras tertinggi sepanjang masa yang baharu pada $111,000 tetapi gagal untuk mengukuh di atas paras tersebut. Token ini, bersama pasaran kripto yang lebih luas, terus

Pati Gani 09:49 2025-05-22 UTC+2

Analisis Teknikal Pergerakan Harga Intraday Indeks Nasdaq 100, Khamis 22 Mei 2025.

Dengan kemunculan Divergensi antara pergerakan harga indeks Nasdaq 100 yang membentuk corak Gandaan Atas (Double Top) dan penunjuk Pengayun Stochastic, ditambah dengan pengesahan daripada pergerakan harganya yang bergerak di bawah

Arief Makmur 07:01 2025-05-22 UTC+2
Tidak boleh bertanya sekarang?
Tanya soalan anda di Ruangan bersembang.
Panggilan semula Widget
 

Dear visitor,

Your IP address shows that you are currently located in the USA. If you are a resident of the United States, you are prohibited from using the services of InstaFintech Group including online trading, online transfers, deposit/withdrawal of funds, etc.

If you think you are seeing this message by mistake and your location is not the US, kindly proceed to the website. Otherwise, you must leave the website in order to comply with government restrictions.

Why does your IP address show your location as the USA?

  • - you are using a VPN provided by a hosting company based in the United States;
  • - your IP does not have proper WHOIS records;
  • - an error occurred in the WHOIS geolocation database.

Please confirm whether you are a US resident or not by clicking the relevant button below. If you choose the wrong option, being a US resident, you will not be able to open an account with InstaForex anyway.

We are sorry for any inconvenience caused by this message.