empty
22.08.2024 01:51 PM
EUR/USD. August 22. Business activity index cools down buyer enthusiasm

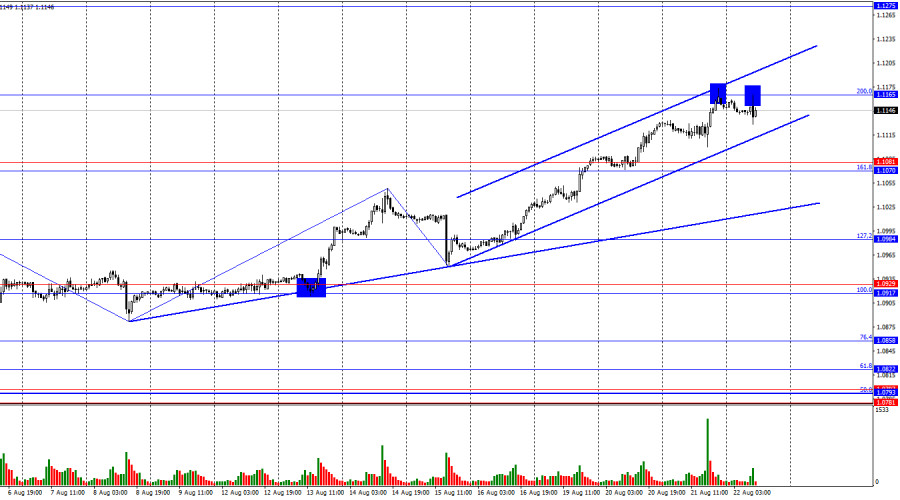
On Wednesday, the EUR/USD pair rose to the 200.0% corrective level at 1.1165. Two rejections from this level currently suggest a possible reversal in favor of the U.S. dollar and a slight decline toward the support zone of 1.1070–1.1081. However, it is not certain that the price will manage to consolidate below the upward trend channel, as the "bullish" trend remains very strong. The pair's growth would likely have continued this morning if the Eurozone business activity indices hadn't been weaker than expected. Consolidation above the 1.1165 level would signal a further rise toward the next Fibonacci level of 261.8% at 1.1318.

This image is no longer relevant

The wave situation has become a bit more complex but remains clear overall. The last completed downward wave did not break the low of the previous wave, while the new upward wave broke the peak from August 14. Thus, the "bullish" trend is still intact. For the "bullish" trend to be invalidated, the bears would need to break the low of the last downward wave, which is near the 1.0950 level.

The news flow on Wednesday was nearly nonexistent. Only in the second half of the day did the new Nonfarm Payrolls report (in annual terms) come in weaker than market expectations, triggering a new decline in the U.S. dollar. However, in my view, the decline of the U.S. currency would have continued even without this report, just as it did on Monday or Tuesday. This morning, business activity reports were released in Germany and the Eurozone. Three out of four indicators were weaker than expected. The only positive was the Eurozone services PMI, which rose from 51.9 to 53.3 points. As we can see, the impact of this information was only enough to pause the continuous growth. I don't believe that this pause marks the end. Typically, trends end abruptly, and we are not seeing any sharp reversals at the moment.

This image is no longer relevant

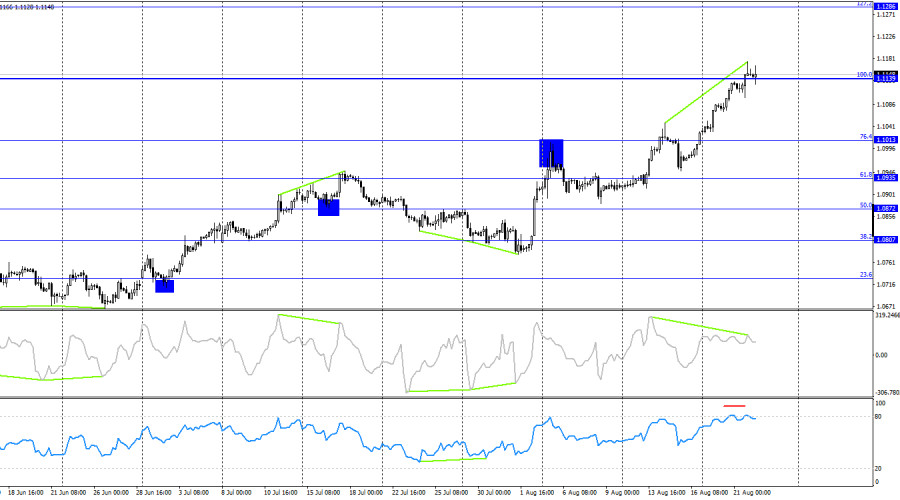
On the 4-hour chart, the pair rose to the 100.0% Fibonacci level at 1.1139 and held just above it. The CCI indicator has been signaling a "bearish" divergence for several days, and the RSI is in overbought territory. Thus, many factors suggest a potential decline in the pair by the end of the week. However, significant growth for the dollar seems unlikely at this point. Even if a downward trend begins, it will take quite some time to obtain the necessary confirmations. For now, I only anticipate a slight downward correction.

Commitments of Traders (COT) Report:

This image is no longer relevant

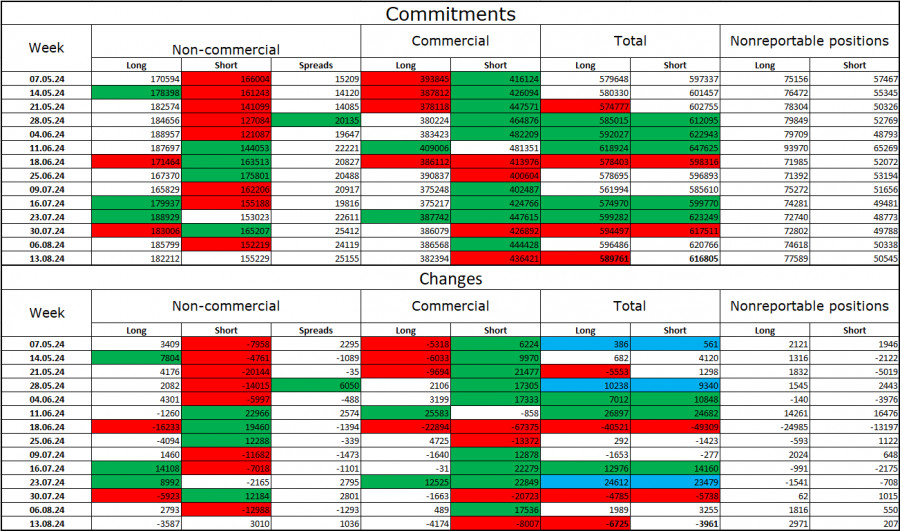
During the last reporting week, speculators closed 3,587 long positions and opened 3,010 short positions. The sentiment of the "Non-commercial" group turned "bearish" several months ago, but bulls have regained dominance. The total number of long positions held by speculators is now 182,000, while short positions total 155,000.

I still believe that the situation will continue to shift in favor of the bears. I see no long-term reasons to buy the euro, as the ECB's monetary easing will reduce yields on bank deposits and government bonds. In the U.S., yields are likely to remain high at least until September, making the dollar more attractive to investors. The potential for a euro decline is significant. However, one should not overlook the technical analysis, which currently does not suggest a strong fall for the euro.

News Calendar for the U.S. and Eurozone:

  • Eurozone – Germany Manufacturing PMI (07:30 UTC)
  • Eurozone – Germany Services PMI (07:30 UTC)
  • Eurozone – Manufacturing PMI (08:00 UTC)
  • Eurozone – Services PMI (08:00 UTC)
  • U.S. – Initial Jobless Claims (12:30 UTC)
  • U.S. – Manufacturing PMI (13:45 UTC)
  • U.S. – Services PMI (13:45 UTC)

On August 22, the economic calendar contains a significant number of entries. The impact of the information background on trader sentiment will be notable for the first time this week.

Forecast for EUR/USD and Trading Tips:

Selling the pair today can be considered on a rebound from the 1.1165 level on the hourly chart, targeting 1.1070–1.1081. Purchases were possible upon closing above the 1.1080 level on the hourly chart with a target of 1.1140, which was reached. New long positions can be considered upon the formation of buy signals near the levels of 1.1070–1.1081 or 1.1165 on the hourly chart.

Fibonacci grids are constructed from 1.0917–1.0668 on the hourly chart and from 1.1139–1.0603 on the 4-hour chart.

Pilih carta masa
5
min
15
min
30
min
1
jam
4
jam
1
hari
1
minggu
Jana pendapatan melalui perubahan kadar mata wang kripto dengan InstaForex.
Muat turun MetaTrader 4 dan buka dagangan pertama anda.
  • Grand Choice
    Contest by
    InstaForex
    InstaForex always strives to help you
    fulfill your biggest dreams.
    SERTAI PERADUAN

Artikel yang dicadangkan

Ramalan untuk EUR/USD pada 30 Mei 2025

Pada hari Khamis, pasangan EUR/USD membuat pembalikan mendadak memihak kepada euro dan meningkat ke zon rintangan 1.1374–1.1380. Pemulihan dari zon ini memberi kelebihan kepada dolar A.S. dan kemungkinan penyambungan semula

Samir Klishi 10:58 2025-05-30 UTC+2

Ramalan untuk GBP/USD pada 30 Mei, 2025

Pada carta jam, pasangan GBP/USD turun ke paras 1.3425 pada hari Khamis, kemudian pulih dan berpusing memihak kepada pound British. Ini memulakan proses pertumbuhan ke arah tahap Fibonacci 161.8% pada

Samir Klishi 10:41 2025-05-30 UTC+2

Ramalan untuk EUR/USD pada 30 Mei 2025

Seperti mata wang anti-dolar lain, euro dengan cepat mengatasi berita negatif dari U.S. Court of International Trade dan menutup hari dengan kenaikan sebanyak 76 pip. Pagi ini, harga menghampiri rintangan

Laurie Bailey 05:26 2025-05-30 UTC+2

Ramalan untuk GBP/USD pada 30 Mei, 2025

Pada hari Khamis, pound British mencapai paras sokongan sasaran pada 1.3433, selepas itu ia berbalik arah ke atas dan menutup hari dengan keuntungan sebanyak 20 pip. Pengayun Marlin perlahan-lahan berpusing

Laurie Bailey 05:26 2025-05-30 UTC+2

Ramalan untuk USD/JPY pada 30 Mei 2025

Yen Jepun mencatat pergerakan ketara semalam, susut lebih daripada dua angka dari paras tertinggi harian hingga ke penutupan. Gelombang pengukuhan yen yang kuat itu berterusan hari ini, bermula sejak sesi

Laurie Bailey 05:26 2025-05-30 UTC+2

Isyarat Dagangan EMAS untuk 29-30 Mei 2025: jual di bawah $3,317 (7/8 Murray - 21 SMA)

Dari segi teknikal, emas dilihat sebagai terlebih beli, namun begitu, pembetulan teknikal mungkin berlaku dalam beberapa jam akan datang, dan ini boleh dianggap sebagai peluang untuk menjual di bawah 3,335

Dimitrios Zappas 15:58 2025-05-29 UTC+2

Isyarat Dagangan untuk EUR/USD bagi 29-30 Mei 2025: jual di bawah 1.1360 (21 SMA - 5/8 Murray)

Di awal sesi dagangan Amerika, euro diperdagangkan sekitar 1.1331 dan sedang mengalami pemulihan teknikal yang kuat selepas mencapai tahap 4/8 Murray pada 1.1230. Euro mungkin meningkat dalam beberapa jam akan

Dimitrios Zappas 15:53 2025-05-29 UTC+2

Ramalan untuk EUR/USD pada 29 Mei 2025

Pada hari Rabu, pasangan EUR/USD terus mengalami penurunan dan mengukuh di bawah zon sokongan di 1.1260–1.1282. Oleh demikian, penurunan harga hari ini mungkin berlanjutan ke paras seterusnya bagi penarikan semula

Samir Klishi 11:15 2025-05-29 UTC+2

Ramalan untuk GBP/USD pada 29 Mei 2025

Pada carta setiap jam, pasangan GBP/USD jatuh ke paras 1.3425 pada hari Rabu. Pemulihan daripada paras ini akan menguntungkan pound dan berpotensi membawa kepada kenaikan ke arah 161.8% anjakan Fibonacci

Samir Klishi 11:10 2025-05-29 UTC+2

EMAS: Harga Emas Mungkin Terus Menurun

Harga emas terus berada di bawah tekanan disebabkan oleh inisiatif prosiding undang-undang di Amerika Syarikat dan pengukuhan dolar AS dalam pasaran Forex. Nampaknya sejumlah besar peserta pasaran bertaruh bahawa pertempuran

Pati Gani 09:49 2025-05-29 UTC+2
Tidak boleh bertanya sekarang?
Tanya soalan anda di Ruangan bersembang.
Panggilan semula Widget
 

Dear visitor,

Your IP address shows that you are currently located in the USA. If you are a resident of the United States, you are prohibited from using the services of InstaFintech Group including online trading, online transfers, deposit/withdrawal of funds, etc.

If you think you are seeing this message by mistake and your location is not the US, kindly proceed to the website. Otherwise, you must leave the website in order to comply with government restrictions.

Why does your IP address show your location as the USA?

  • - you are using a VPN provided by a hosting company based in the United States;
  • - your IP does not have proper WHOIS records;
  • - an error occurred in the WHOIS geolocation database.

Please confirm whether you are a US resident or not by clicking the relevant button below. If you choose the wrong option, being a US resident, you will not be able to open an account with InstaForex anyway.

We are sorry for any inconvenience caused by this message.