empty
03.03.2025 10:41 AM
Funds React with Growth Amid White House Scandal

This image is no longer relevant

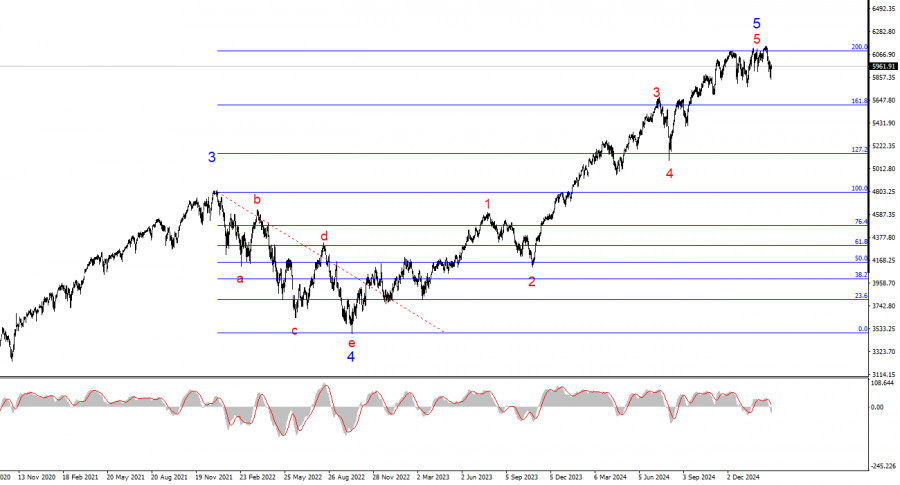
The wave structure on the 4-hour chart for #SPX appears uncertain but generally clear. The 24-hour chart reveals a global five-wave structure, so expansive that it does not fully fit within the terminal window even at the minimum scale. In simple terms, U.S. stock indices have been in an uptrend for a very long time. However, we know that trends eventually reverse. Currently, the formation of wave 5 in wave 5 is ongoing. The index has made four unsuccessful attempts to break above 6093, which corresponds to 200.0% Fibonacci retracement from wave 4. In my view, a new corrective wave or a series of corrections is likely in the near future. The U.S. stock market is overheated, and more analysts are beginning to talk about a "bubble."

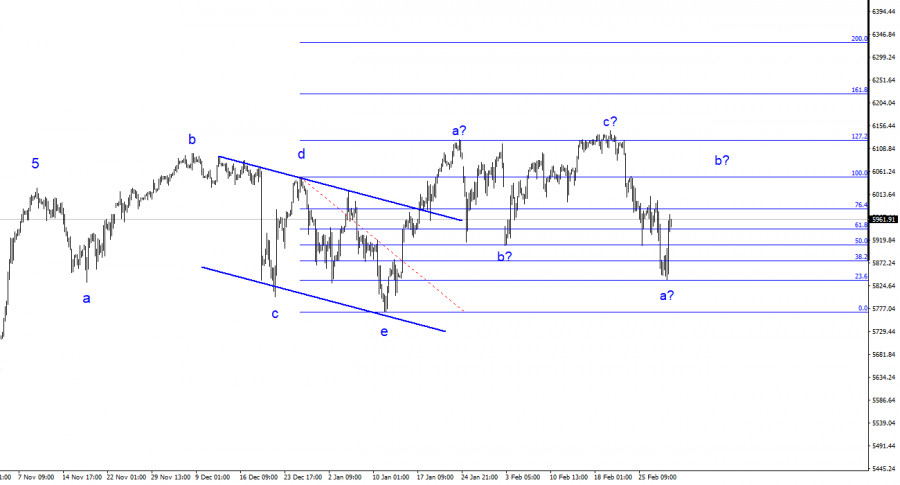
Switching to the 4-hour chart, we can observe a completed complex corrective structure (a-b-c-d-e) followed by a new upward wave structure in an a-b-c formation. This suggests that a new bearish structure is now forming, with wave b currently unfolding, after which further decline should resume. Another upward impulse could occur, but it would likely be followed by a more significant drop in the index. At this stage, I would rely more on the daily chart analysis.

The #SPX continues trading near historical peaks, and investors remain reluctant to exit their positions in major U.S. stocks. As I previously mentioned, the stock market entered a new bullish phase nearly two years ago, when U.S. inflation began slowing, and expectations of Federal Reserve monetary policy easing emerged. Now, this process is fully underway, and I would not expect further significant gains in U.S. stock indices as the market has already priced in these factors.

The fundamental backdrop for U.S. stock indices continues to deteriorate. The latest GDP report came in weaker than expected, indicating that the economy is slowing down. The Federal Reserve has essentially halted its monetary policy easing, whereas the stock market favors looser financial conditions and dislikes tightening. Stocks thrive in a dovish monetary environment or at least when easing is expected, which has been the case for the past two years.

Now, however, inflation in the U.S. is rising again, and Trump's policies are likely to accelerate it even further. The U.S. president's approach to international affairs is causing more investor concern than optimism. I still believe we are in for a prolonged and complex correction, making it unlikely that we will see further growth in stock indices.

Over the weekend, a scandal erupted at the White House involving Donald Trump and Volodymyr Zelensky. The fallout led to Ukraine backing out of a natural resources deal and the U.S. withdrawing further financial support for Ukraine. Over the past six weeks, almost every geopolitical development of this nature has fueled demand for U.S. stocks. However, I still expect SP500 and other indices to decline.

This image is no longer relevant

General Conclusions

Based on my #SPX analysis, I conclude that the index is nearing the end of its uptrend. Given the current situation, I suggest monitoring the 6125 level and Trump's economic policies. Trump is making decisions that threaten the stability of the U.S. economy and major American corporations, including trade wars, tariffs, and import restrictions. The likelihood of a new downtrend is increasing daily. The "bubble" in the U.S. stock market is at its peak. The 4-hour chart suggests another potential upward move before a drop, while the 24-hour chart points to the conclusion of the uptrend.

On the higher wave scale, the structure is much clearer—a five-wave bullish cycle with a five-wave pattern within the final wave. This fifth wave appears to be approaching its end. As a result, I would prepare for a prolonged and complex correction, which may have already begun.

Key Principles of My Analysis:

  1. Wave structures should be simple and clear. Complex formations are difficult to trade and often require adjustments.
  2. If you are uncertain about market conditions, it is better to stay out.
  3. There is never 100% certainty in market direction. Always use Stop-Loss orders to protect capital.
  4. Wave analysis can be combined with other analytical methods and trading strategies.
Pilih carta masa
5
min
15
min
30
min
1
jam
4
jam
1
hari
1
minggu
Jana pendapatan melalui perubahan kadar mata wang kripto dengan InstaForex.
Muat turun MetaTrader 4 dan buka dagangan pertama anda.
  • Grand Choice
    Contest by
    InstaForex
    InstaForex always strives to help you
    fulfill your biggest dreams.
    SERTAI PERADUAN

Artikel yang dicadangkan

Kemas Kini Mengenai Pasaran Saham AS pada 28 Mei

S&P500 Pasaran saham AS menunjukkan pertumbuhan yang pesat Gambaran ringkas indeks saham utama AS pada hari Selasa: Dow Jones: +1.8% NASDAQ: +2.5% S&P 500: +2.1% S&P 500 pada 5,921 dalam

Jozef Kovach 10:38 2025-05-28 UTC+2

Pasaran Saham pada 28 Mei: S&P 500 dan NASDAQ Terus Meningkat dengan Pesat

Selepas sesi biasa yang terbaharu, indeks saham A.S. ditutup dengan kenaikan yang kukuh. S&P 500 meningkat sebanyak 2.00%, manakala Nasdaq 100 menambah 2.47%. Dow Jones Industrial Average melonjak 1.78%. Kenaikan

Jakub Novak 09:43 2025-05-28 UTC+2

Ramalan S&P 500 untuk 28 Mei 2025

Indeks saham AS, S&P 500, telah menyelesaikan fasa pembetulan yang bermula pada 20 Mei. Petunjuk kepada penyempurnaan ini ialah penembusan harga melepasi sempadan dalaman saluran harga hijau serta paras sasaran

Laurie Bailey 05:08 2025-05-28 UTC+2

Permintaan Domestik dan Harga yang Menarik

Struktur gelombang pada carta 24 jam bagi instrumen #SPX secara umumnya mudah untuk ditafsirkan. Corak lima gelombang global bahkan tidak muat dalam tetingkap terminal pada skala terkecil, menandakan betapa lamanya

Chin Zhao 11:56 2025-05-27 UTC+2

Kemas Kini Pasaran Saham untuk 27 Mei: S&P 500 dan NASDAQ Masih Mempunyai Potensi Pertumbuhan

Selepas sesi biasa terbaru, indeks saham AS ditutup lebih rendah. S&P 500 jatuh sebanyak 0.67%, manakala Nasdaq 100 kehilangan 1.00%. Dow Jones industri susut sebanyak 0.61%. Semalam, pasaran ditutup susulan

Jakub Novak 11:08 2025-05-27 UTC+2

Kemas Kini Pasaran Saham AS pada 27 Mei: Pasaran Mula Mengumpul Momentum

S&P500 Gambaran ringkas indeks utama saham AS pada hari Isnin: Dow: -0%, NASDAQ: -0%, S&P 500: -0%, S&P 500 pada paras 5802, dengan julat dagangan antara 5400–6200. Pada hari Isnin

Jozef Kovach 10:40 2025-05-27 UTC+2

Trump mengubah retoriknya, USD kehilangan kedudukan

Dunia sedang berubah lebih pantas daripada pasaran dapat berkedip. Dolar dengan pantas kehilangan kedudukannya di tengah-tengah gencatan perang perdagangan AS-EU. Nvidia terpaksa menurunkan harga AI untuk China di bawah tekanan

Аlena Ivannitskaya 13:05 2025-05-26 UTC+2

Ramalan Pasaran Saham untuk 26 Mei: S&P 500 dan NASDAQ Kembali Berkembang

Dalam sesi biasa yang lalu, indeks saham Amerika Syarikat ditutup lebih rendah. S&P 500 jatuh sebanyak 0.67%, Nasdaq 100 kehilangan 1.00%, dan Dow Jones Industrial Average merosot sebanyak 0.61%. Bagaimanapun

Jakub Novak 11:50 2025-05-26 UTC+2

Kemaskini mengenai pasaran saham AS pada 26 Mei

S&P500 PASARAN SAHAM AS MENINGKAT Gambaran utama indeks saham AS pada hari Jumaat: Dow -0.6%, NASDAQ -1%, S&P 500 -0.7%, S&P 500 di 5,802, julat 5,400–6,200. Pentingnya, pada pagi Isnin

Jozef Kovach 10:35 2025-05-26 UTC+2

Cadangan Beli dan Jual Pasaran Saham untuk 26 Mei 2025

Cadangan Pembelian: Freeport-McMoRan Copper & Gold (#FCX) Freeport-McMoRan adalah salah satu pengeluar logam bukan ferus terbesar di dunia. Pada carta harian, pembetulan telah selesai, dengan harga mengukuh di atas tahap

Laurie Bailey 06:59 2025-05-26 UTC+2
Tidak boleh bertanya sekarang?
Tanya soalan anda di Ruangan bersembang.
Panggilan semula Widget
 

Dear visitor,

Your IP address shows that you are currently located in the USA. If you are a resident of the United States, you are prohibited from using the services of InstaFintech Group including online trading, online transfers, deposit/withdrawal of funds, etc.

If you think you are seeing this message by mistake and your location is not the US, kindly proceed to the website. Otherwise, you must leave the website in order to comply with government restrictions.

Why does your IP address show your location as the USA?

  • - you are using a VPN provided by a hosting company based in the United States;
  • - your IP does not have proper WHOIS records;
  • - an error occurred in the WHOIS geolocation database.

Please confirm whether you are a US resident or not by clicking the relevant button below. If you choose the wrong option, being a US resident, you will not be able to open an account with InstaForex anyway.

We are sorry for any inconvenience caused by this message.