empty
28.03.2025 11:48 AM
EUR/USD. March 28th. Bears Retreat, but Haven't Surrendered

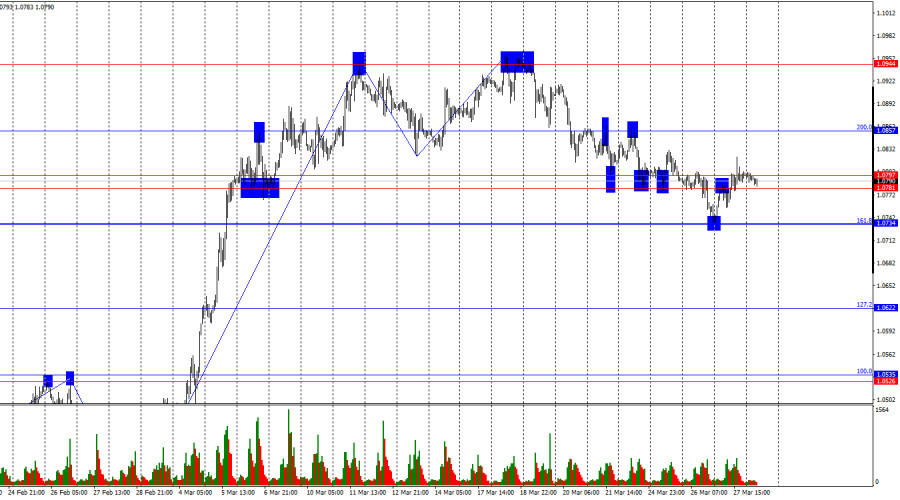
On Thursday, the EUR/USD pair rebounded from the 161.8% Fibonacci retracement level at 1.0734 and rose to the resistance zone of 1.0781–1.0797. A rebound from this zone would favor the U.S. dollar and a renewed decline toward 1.0734. A breakout and consolidation above this zone would allow the euro to continue rising toward the next Fibonacci level of 200.0% at 1.0857.

This image is no longer relevant

The wave structure on the hourly chart has changed. The last completed upward wave broke the previous peak by just a few points, while the last downward wave broke the previous low. This suggests a gradual trend reversal in a bearish direction. Donald Trump's tariffs have put strong pressure on the dollar over the past few weeks, but the market has reacted rather weakly to the latest round of tariffs.

Thursday's news background was important, but not in the way traders had hoped. Overnight, it was announced that Donald Trump had imposed 25% tariffs on all imported cars, rendering the rest of the day's events irrelevant for market participants. The dollar remained under pressure all day, even despite stronger-than-expected U.S. GDP data. Countries affected by the new tariffs, especially the European Union, are likely preparing a response. We are clearly in the midst of a trade war. However, traders are no longer rushing to sell the dollar. While the dollar fell all day yesterday, the decline was not particularly strong. The market is gradually coming to terms with the new reality, which implies that more rounds of tariffs from the U.S. are likely. If the dollar falls with each new round, it could soon drop to around 1.20. Still, the dollar's value should be influenced by more than just Trump—and the market understands that. As mentioned, the U.S. GDP report beat expectations.

This image is no longer relevant

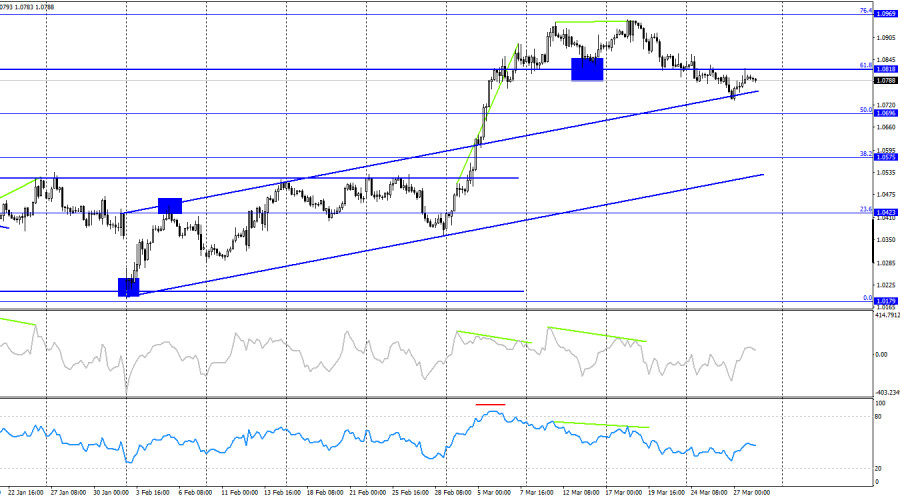
On the 4-hour chart, the pair reversed in favor of the U.S. dollar following the formation of another bearish divergence and a consolidation below the 61.8% Fibonacci level at 1.0818. This suggests continued decline toward the next retracement level at 50.0% – 1.0696. The euro still has room to fall, as the price remains above the upward trend channel. No emerging divergences are currently observed on any indicator.

Commitments of Traders (COT) Report:

This image is no longer relevant

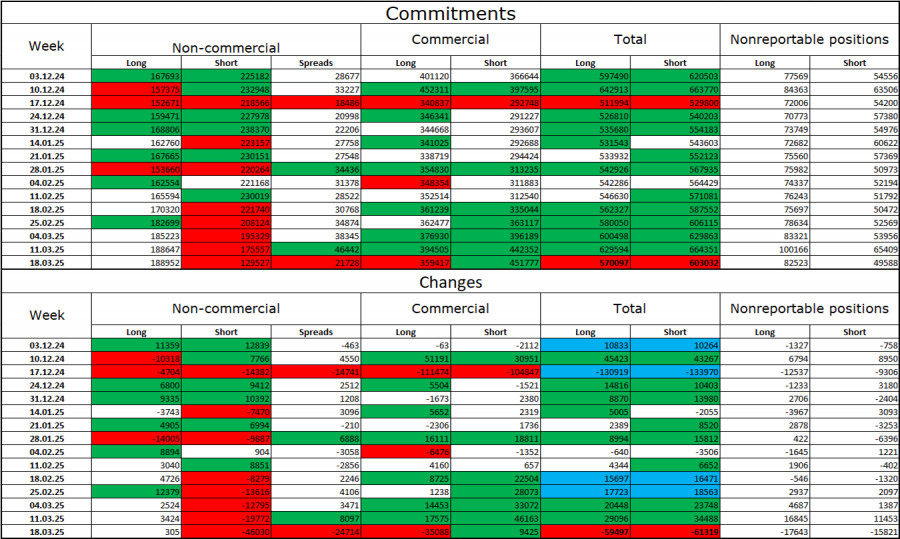
During the most recent reporting week, professional traders opened 305 long positions and closed 46,030 short positions. The "Non-commercial" group's sentiment has once again turned bullish—thanks to Donald Trump. The total number of long positions held by speculators now stands at 189,000, while short positions have dropped to 129,000.

For twenty consecutive weeks, large players were shedding euro positions, but they've now been reducing short positions and increasing long ones for six straight weeks. The diverging paths in monetary policy between the ECB and the Fed still favor the U.S. dollar due to the widening interest rate differential. However, Trump's policy is a stronger factor for traders, as it could have a dovish effect on the FOMC and even lead to a recession in the U.S. economy.

Economic Calendar for the U.S. and the Eurozone:

  • Eurozone – Germany Unemployment Rate (08:55 UTC)
  • U.S. – PCE Price Index (12:30 UTC)
  • U.S. – Personal Income and Spending (12:30 UTC)
  • U.S. – University of Michigan Consumer Sentiment Index (14:00 UTC)

On March 28, the economic calendar includes four events, none of which are considered highly important. As a result, the impact of news flow on market sentiment on Friday may be limited.

EUR/USD Forecast and Trading Tips:

Selling the pair was possible after a close below the 1.0781–1.0797 zone, targeting 1.0734 and 1.0622. The first target has been reached. Today, short positions can be considered on a bounce from the 1.0781–1.0797 zone with the same targets. Long positions may be considered on an hourly close above this zone, targeting 1.0857, but for now, bears remain in control.

Fibonacci levels are plotted from 1.0529 to 1.0213 on the hourly chart and from 1.1214 to 1.0179 on the 4-hour chart.

Pilih carta masa
5
min
15
min
30
min
1
jam
4
jam
1
hari
1
minggu
Jana pendapatan melalui perubahan kadar mata wang kripto dengan InstaForex.
Muat turun MetaTrader 4 dan buka dagangan pertama anda.
  • Grand Choice
    Contest by
    InstaForex
    InstaForex always strives to help you
    fulfill your biggest dreams.
    SERTAI PERADUAN

Artikel yang dicadangkan

Analisis GBP/USD pada 14 Mei 2025

Pada carta setiap jam, pasangan GBP/USD meneruskan pergerakan ke atas pada hari Selasa selepas melantun dari tahap 1.3139. Berdasarkan struktur gelombang, aliran menurun belum secara rasmi ditembusi, tetapi ia hampir-hampir

Samir Klishi 11:17 2025-05-14 UTC+2

Analisis Teknikal Pergerakan Harga Harian Pasangan Mata Wang Silang AUD/JPY, Rabu 14 Mei 2025.

Walaupun pada carta 4 jam pasangan mata wang silang AUD/JPY masih bergerak di atas WMA (30 Shift 2) yang turut mempunyai cerun ke atas, tetapi kerana penunjuk Pengayun Stochastic sudah

Arief Makmur 07:42 2025-05-14 UTC+2

Analisis Teknikal Pergerakan Harga Harian Instrumen Komoditi Minyak Mentah, Rabu 14 Mei, 2025.

Daripada apa yang dilihat pada carta 4 jam bagi instrumen komoditi Minyak Mentah (Crude Oil), terdapat beberapa fakta menarik. Pertama, kemunculan corak Gandaan Bawah (Double Bottom) yang diikuti oleh Konvergensi

Arief Makmur 07:42 2025-05-14 UTC+2

Ramalan EUR/USD untuk 14 Mei, 2025

Pada hari Selasa, euro memilih untuk tidak lagi menentang sentimen pasaran dan menyertai aliran risiko-positif yang lebih meluas. Indeks saham AS S&P 500 meningkat sebanyak 0.72%, indeks dolar susut sebanyak

Laurie Bailey 05:03 2025-05-14 UTC+2

Ramalan GBP/USD untuk 14 Mei, 2025

Di tengah lonjakan selera risiko dan keyakinan pasaran secara umum semalam (S&P 500 +0.72%, WTI +2.78%, Indeks Dolar -0.76%), pound British tidak mencuba untuk menguji sokongan sasaran pada 1.3101. Sebaliknya

Laurie Bailey 05:03 2025-05-14 UTC+2

Ramalan AUD/USD untuk 14 Mei 2025

Dolar Australia telah melebihi julat 0.6394–0.6444. Garisan isyarat pengayun Marlin berbalik ke atas sebelum mencapai sempadan zon penurunan. Mempertimbangkan kemungkinan turun naik, membenarkan pengayun menguji sempadan tersebut adalah munasabah. Harga

Laurie Bailey 05:03 2025-05-14 UTC+2

Isyarat Dagangan untuk EMAS untuk 12-15 Mei 2025: beli di atas $3,225 (200 EMA - 6/8 Murray)

Pada awal sesi dagangan AS, emas diniagakan sekitar 3,249, melonjak semula selepas mencapai paras terendah 3,224, yang bertepatan dengan EMA 200. Selepas mencapai dasar ini, emas kembali meningkat dengan yakin

Dimitrios Zappas 18:50 2025-05-13 UTC+2

Isyarat Dagangan untuk EUR/USD bagi 13-19 Mei, 2025: jual di bawah 1.1184 (200 EMA - 21 SMA)

Pada awal sesi Amerika, euro sedang didagangkan sekitar 1.1171, di bawah 200 EMA dan di bawah 21 SMA. Pada carta H4, kita dapat melihat bahawa euro, setelah mencapai titik terendah

Dimitrios Zappas 18:49 2025-05-13 UTC+2

Ramalan untuk EUR/USD pada 13 Mei 2025

Pada hari Isnin, pasangan EUR/USD meneruskan kejatuhannya setelah melantun dari zon rintangan 1.1265–1.1282 pada hari Jumaat. Pasangan ini menyatu di bawah paras 127.2% Fibonacci pada 1.1181 dan jatuh

Samir Klishi 11:02 2025-05-13 UTC+2

GBP/USD – 13 Mei: Kadar Pengangguran di UK Meningkat Semula

Pada carta setiap jam, pasangan GBP/USD telah jatuh ke tahap 1.3139 pada hari Isnin, kemudian pulih daripadanya, dan naik ke paras Fibonacci 100.0% pada 1.3205. Pemulihan daripada tahap ini akan

Samir Klishi 10:49 2025-05-13 UTC+2
Tidak boleh bertanya sekarang?
Tanya soalan anda di Ruangan bersembang.
Panggilan semula Widget
 

Dear visitor,

Your IP address shows that you are currently located in the USA. If you are a resident of the United States, you are prohibited from using the services of InstaFintech Group including online trading, online transfers, deposit/withdrawal of funds, etc.

If you think you are seeing this message by mistake and your location is not the US, kindly proceed to the website. Otherwise, you must leave the website in order to comply with government restrictions.

Why does your IP address show your location as the USA?

  • - you are using a VPN provided by a hosting company based in the United States;
  • - your IP does not have proper WHOIS records;
  • - an error occurred in the WHOIS geolocation database.

Please confirm whether you are a US resident or not by clicking the relevant button below. If you choose the wrong option, being a US resident, you will not be able to open an account with InstaForex anyway.

We are sorry for any inconvenience caused by this message.