


signal strength 4 of 5
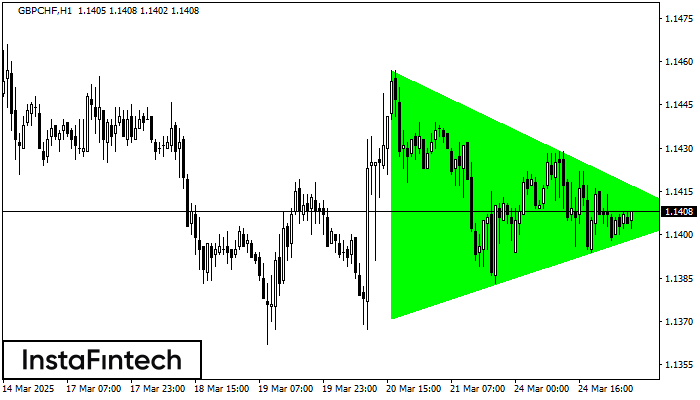
According to the chart of H1, GBPCHF formed the Bullish Symmetrical Triangle pattern. Description: This is the pattern of a trend continuation. 1.1457 and 1.1371 are the coordinates of the upper and lower borders respectively. The pattern width is measured on the chart at 86 pips. Outlook: If the upper border 1.1457 is broken, the price is likely to continue its move by 1.1446.
- All
- Double Top
- Flag
- Head and Shoulders
- Pennant
- Rectangle
- Triangle
- Triple top
- All
- #AAPL
- #AMZN
- #Bitcoin
- #EBAY
- #FB
- #GOOG
- #INTC
- #KO
- #MA
- #MCD
- #MSFT
- #NTDOY
- #PEP
- #TSLA
- #TWTR
- AUDCAD
- AUDCHF
- AUDJPY
- AUDUSD
- EURCAD
- EURCHF
- EURGBP
- EURJPY
- EURNZD
- EURRUB
- EURUSD
- GBPAUD
- GBPCHF
- GBPJPY
- GBPUSD
- GOLD
- NZDCAD
- NZDCHF
- NZDJPY
- NZDUSD
- SILVER
- USDCAD
- USDCHF
- USDJPY
- USDRUB
- All
- M5
- M15
- M30
- H1
- D1
- All
- Buy
- Sale
- All
- 1
- 2
- 3
- 4
- 5

Corak Double Bottom telah dibentuk pada EURCAD M30. Ciri-ciri: tahap sokongan 1.5599; tahap rintangan 1.5621; lebar corak 22 mata. Sekiranya tahap rintangan ditembusi, perubahan aliran boleh diramalkan dengan titik sasaran
Open chart in a new window
Berdasarkan carta M5, EURUSD telah membentuk Segi Empat Menurun. Jenis corak ini menunjukkan kesinambungan aliran. Ia terdiri daripada dua tahap: rintangan 1.1308 - 0.0000 dan sokongan 1.1292 – 1.1292. Sekiranya
Carta masa M5 dan M15 mungkin mempunyai lebih banyak titik kemasukan palsu.
Open chart in a new window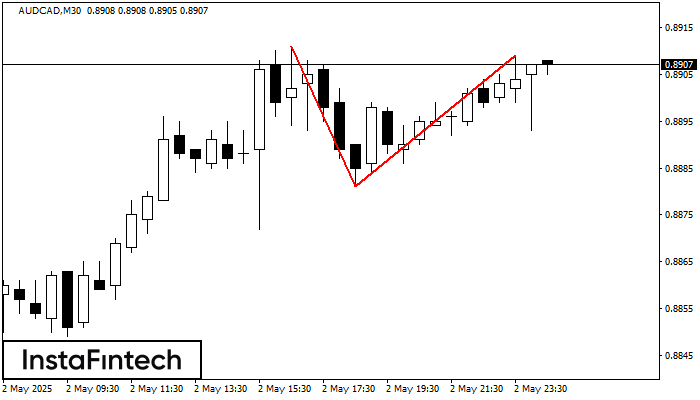
Corak Double Top telah dibentuk pada AUDCAD M30. Isyarat bahawa aliran telah berubah dari aliran menaik ke aliran menurun. Mungkin, sekiranya asas corak 0.8881 ditembusi, pergerakan menurun akan berterusan
Open chart in a new window


