

signal strength 1 of 5
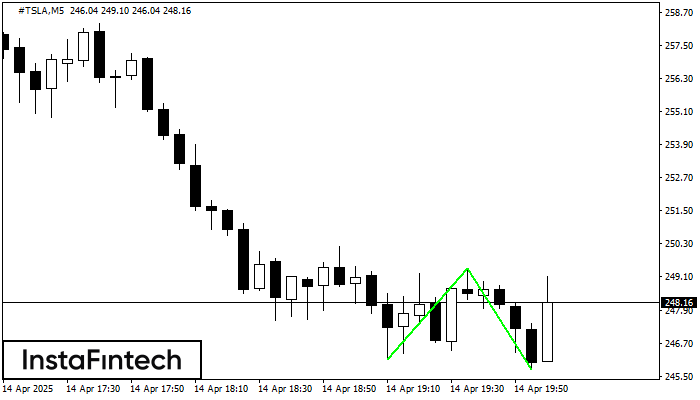
The Double Bottom pattern has been formed on #TSLA M5. This formation signals a reversal of the trend from downwards to upwards. The signal is that a buy trade should be opened after the upper boundary of the pattern 249.40 is broken. The further movements will rely on the width of the current pattern 329 points.
The M5 and M15 time frames may have more false entry points.
Juga lihat
- All
- Double Top
- Flag
- Head and Shoulders
- Pennant
- Rectangle
- Triangle
- Triple top
- All
- #AAPL
- #AMZN
- #Bitcoin
- #EBAY
- #FB
- #GOOG
- #INTC
- #KO
- #MA
- #MCD
- #MSFT
- #NTDOY
- #PEP
- #TSLA
- #TWTR
- AUDCAD
- AUDCHF
- AUDJPY
- AUDUSD
- EURCAD
- EURCHF
- EURGBP
- EURJPY
- EURNZD
- EURRUB
- EURUSD
- GBPAUD
- GBPCHF
- GBPJPY
- GBPUSD
- GOLD
- NZDCAD
- NZDCHF
- NZDJPY
- NZDUSD
- SILVER
- USDCAD
- USDCHF
- USDJPY
- USDRUB
- All
- M5
- M15
- M30
- H1
- D1
- All
- Buy
- Sale
- All
- 1
- 2
- 3
- 4
- 5
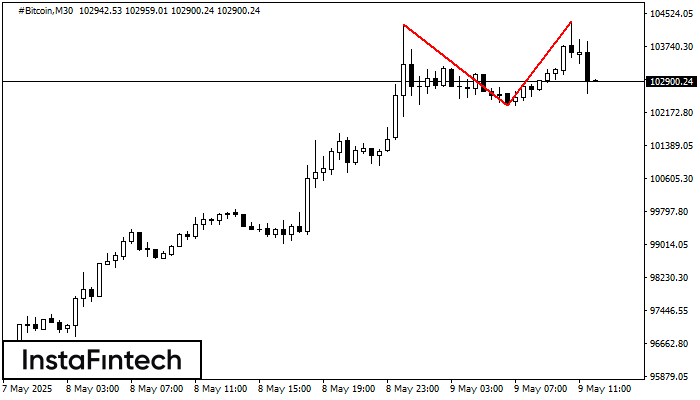
Corak Double Top telah dibentuk pada #Bitcoin M30. Isyarat bahawa aliran telah berubah dari aliran menaik ke aliran menurun. Mungkin, sekiranya asas corak 102332.80 ditembusi, pergerakan menurun akan berterusan
Open chart in a new window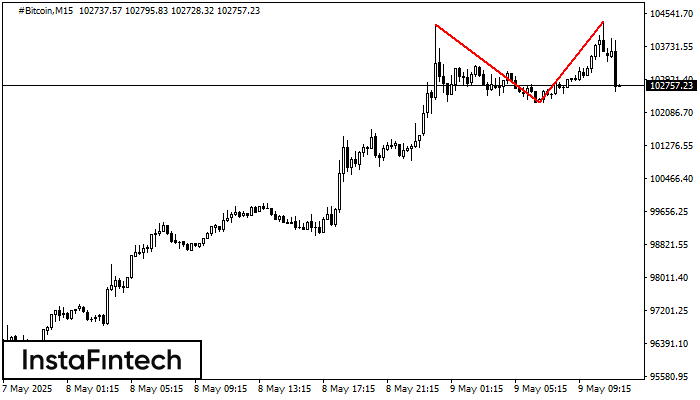
Corak pembalikan Double Top telah dibentuk pada #Bitcoin M15. Ciri-ciri: sempadan atas %P0.000000; sempadan bawah 104269.79; sempadan bawah 102332.80; lebar corak adalah 201342 mata. Dagangan menjual adalah lebih baik untuk
Carta masa M5 dan M15 mungkin mempunyai lebih banyak titik kemasukan palsu.
Open chart in a new window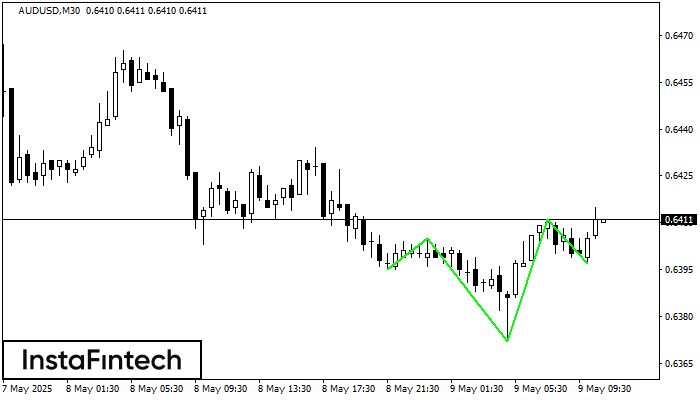
According to M30, AUDUSD is shaping the technical pattern – the Inverse Head dan Shoulder. In case the Neckline 0.6405/0.6411 is broken out, the instrument is likely to move toward
Open chart in a new window


