


signal strength 1 of 5

According to the chart of M5, USDJPY formed the Bullish Symmetrical Triangle pattern, which signals the trend will continue. Description. The upper border of the pattern touches the coordinates 150.95/150.72 whereas the lower border goes across 150.50/150.72. The pattern width is measured on the chart at 45 pips. If the Bullish Symmetrical Triangle pattern is in progress during the upward trend, this indicates the current trend will go on. In case 150.72 is broken, the price could continue its move toward 150.87.
The M5 and M15 time frames may have more false entry points.
See Also
- All
- Double Top
- Flag
- Head and Shoulders
- Pennant
- Rectangle
- Triangle
- Triple top
- All
- #AAPL
- #AMZN
- #Bitcoin
- #EBAY
- #FB
- #GOOG
- #INTC
- #KO
- #MA
- #MCD
- #MSFT
- #NTDOY
- #PEP
- #TSLA
- #TWTR
- AUDCAD
- AUDCHF
- AUDJPY
- AUDUSD
- EURCAD
- EURCHF
- EURGBP
- EURJPY
- EURNZD
- EURRUB
- EURUSD
- GBPAUD
- GBPCHF
- GBPJPY
- GBPUSD
- GOLD
- NZDCAD
- NZDCHF
- NZDJPY
- NZDUSD
- SILVER
- USDCAD
- USDCHF
- USDJPY
- USDRUB
- All
- M5
- M15
- M30
- H1
- D1
- All
- Buy
- Sale
- All
- 1
- 2
- 3
- 4
- 5
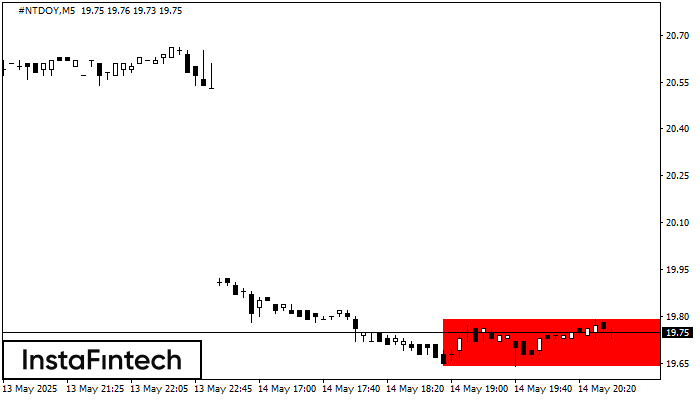
According to the chart of M5, #NTDOY formed the Bearish Rectangle. The pattern indicates a trend continuation. The upper border is 19.79, the lower border is 19.64. The signal means
The M5 and M15 time frames may have more false entry points.
Open chart in a new window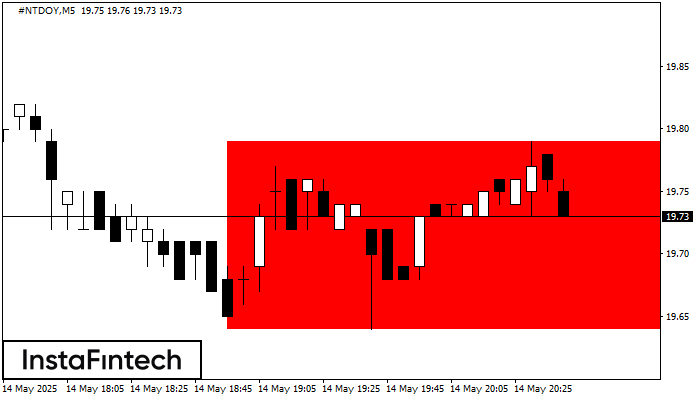
According to the chart of M5, #NTDOY formed the Bearish Rectangle. The pattern indicates a trend continuation. The upper border is 19.79, the lower border is 19.64. The signal means
The M5 and M15 time frames may have more false entry points.
Open chart in a new window
The technical pattern called Head and Shoulders has appeared on the chart of GBPCHF M5. There are weighty reasons to suggest that the price will surpass the Neckline 1.1164/1.1166 after
The M5 and M15 time frames may have more false entry points.
Open chart in a new window


