


signal strength 2 of 5

The Bearish pennant pattern has formed on the AUDUSD M15 chart. It signals potential continuation of the existing trend. Specifications: the pattern’s bottom has the coordinate of 0.6272; the projection of the flagpole height is equal to 19 pips. In case the price breaks out the pattern’s bottom of 0.6272, the downtrend is expected to continue for further level 0.6249.
The M5 and M15 time frames may have more false entry points.
- All
- Double Top
- Flag
- Head and Shoulders
- Pennant
- Rectangle
- Triangle
- Triple top
- All
- #AAPL
- #AMZN
- #Bitcoin
- #EBAY
- #FB
- #GOOG
- #INTC
- #KO
- #MA
- #MCD
- #MSFT
- #NTDOY
- #PEP
- #TSLA
- #TWTR
- AUDCAD
- AUDCHF
- AUDJPY
- AUDUSD
- EURCAD
- EURCHF
- EURGBP
- EURJPY
- EURNZD
- EURRUB
- EURUSD
- GBPAUD
- GBPCHF
- GBPJPY
- GBPUSD
- GOLD
- NZDCAD
- NZDCHF
- NZDJPY
- NZDUSD
- SILVER
- USDCAD
- USDCHF
- USDJPY
- USDRUB
- All
- M5
- M15
- M30
- H1
- D1
- All
- Buy
- Sale
- All
- 1
- 2
- 3
- 4
- 5

The Bullish Flag pattern has been formed on AUDJPY at M5. The lower boundary of the pattern is located at 94.27/94.19, while the higher boundary lies at 94.35/94.27. The projection
The M5 and M15 time frames may have more false entry points.
Open chart in a new window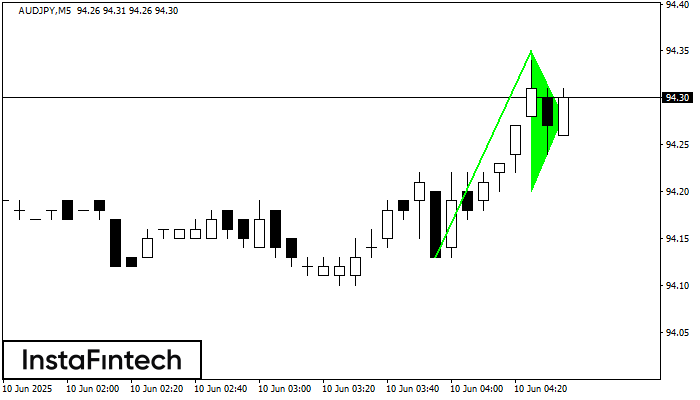
The Bullish pennant signal – Trading instrument AUDJPY M5, continuation pattern. Forecast: it is possible to set up a buy position above the pattern’s high of 94.35, with the prospect
The M5 and M15 time frames may have more false entry points.
Open chart in a new window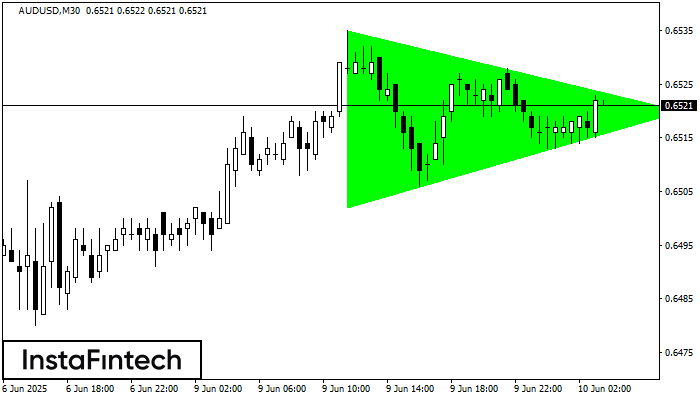
According to the chart of M30, AUDUSD formed the Bullish Symmetrical Triangle pattern. Description: This is the pattern of a trend continuation. 0.6535 and 0.6502 are the coordinates
Open chart in a new window


