


signal strength 1 of 5
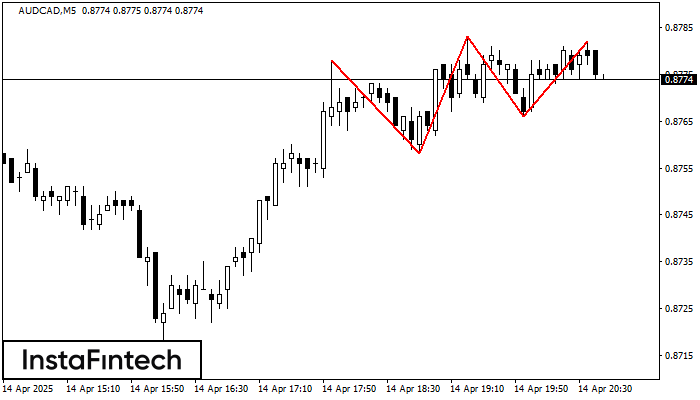
The Triple Top pattern has formed on the chart of the AUDCAD M5 trading instrument. It is a reversal pattern featuring the following characteristics: resistance level -4, support level -8, and pattern’s width 20. Forecast If the price breaks through the support level 0.8758, it is likely to move further down to 0.8768.
The M5 and M15 time frames may have more false entry points.
- All
- Double Top
- Flag
- Head and Shoulders
- Pennant
- Rectangle
- Triangle
- Triple top
- All
- #AAPL
- #AMZN
- #Bitcoin
- #EBAY
- #FB
- #GOOG
- #INTC
- #KO
- #MA
- #MCD
- #MSFT
- #NTDOY
- #PEP
- #TSLA
- #TWTR
- AUDCAD
- AUDCHF
- AUDJPY
- AUDUSD
- EURCAD
- EURCHF
- EURGBP
- EURJPY
- EURNZD
- EURRUB
- EURUSD
- GBPAUD
- GBPCHF
- GBPJPY
- GBPUSD
- GOLD
- NZDCAD
- NZDCHF
- NZDJPY
- NZDUSD
- SILVER
- USDCAD
- USDCHF
- USDJPY
- USDRUB
- All
- M5
- M15
- M30
- H1
- D1
- All
- Buy
- Sale
- All
- 1
- 2
- 3
- 4
- 5
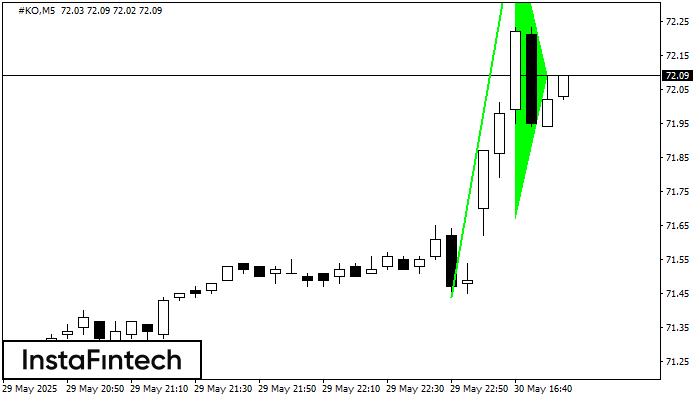
The Bullish pennant signal – Trading instrument #KO M5, continuation pattern. Forecast: it is possible to set up a buy position above the pattern’s high of 72.50, with the prospect
The M5 and M15 time frames may have more false entry points.
Открыть график инструмента в новом окне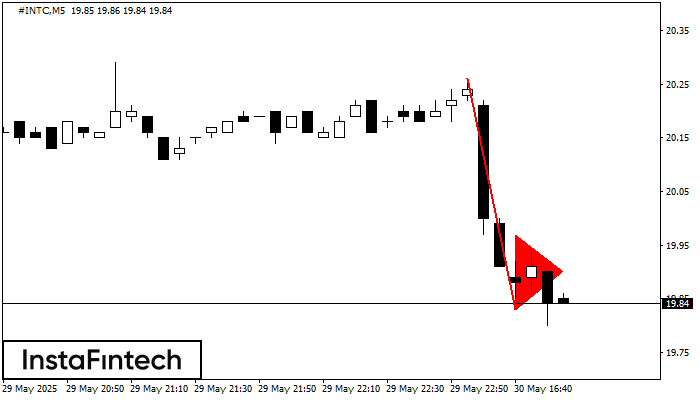
The Bearish pennant pattern has formed on the #INTC M5 chart. The pattern signals continuation of the downtrend in case the pennant’s low of 19.83 is broken through. Recommendations: Place
The M5 and M15 time frames may have more false entry points.
Открыть график инструмента в новом окне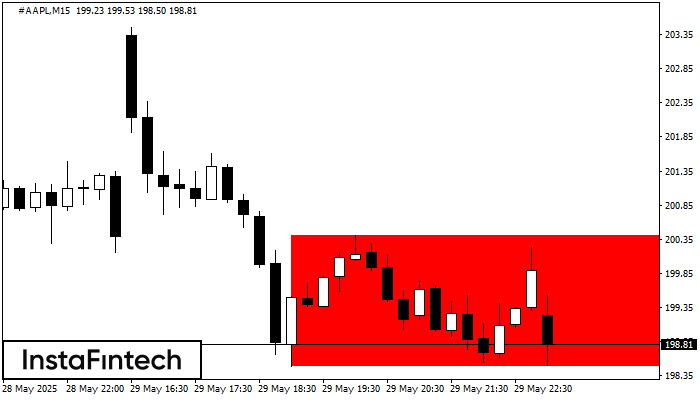
According to the chart of M15, #AAPL formed the Bearish Rectangle. The pattern indicates a trend continuation. The upper border is 200.40, the lower border is 198.49. The signal means
The M5 and M15 time frames may have more false entry points.
Открыть график инструмента в новом окне


