empty
сформирован 03.04 в 04:24:38 (UTC+0)
сила сигнала 1 из 5
Медвежий симметричный треугольник USDCAD M5

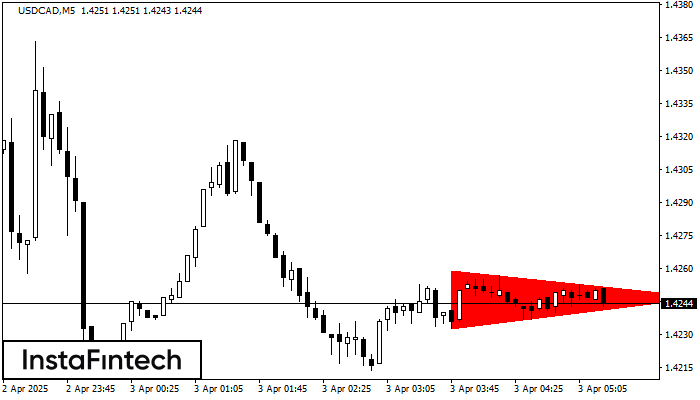
На графике USDCAD на M5 сформировалась фигура «Медвежий симметричный треугольник». Торговые рекомендации: Пробой нижней границы 1.4233 с большой долей вероятности приведет к продолжению нисходящего тренда.

Таймфреймы М5 и М15 могут иметь больше ложных точек входа.

Фигура
  • Все
  • Вымпел
  • Голова и плечи
  • Двойная вершина
  • Прямоугольник
  • Треугольник
  • Тройная вершина
  • Флаг
Инструмент
  • Все
  • #AAPL
  • #AMZN
  • #Bitcoin
  • #EBAY
  • #FB
  • #GOOG
  • #INTC
  • #KO
  • #MA
  • #MCD
  • #MSFT
  • #NTDOY
  • #PEP
  • #TSLA
  • #TWTR
  • AUDCAD
  • AUDCHF
  • AUDJPY
  • AUDUSD
  • EURCAD
  • EURCHF
  • EURGBP
  • EURJPY
  • EURNZD
  • EURRUB
  • EURUSD
  • GBPAUD
  • GBPCHF
  • GBPJPY
  • GBPUSD
  • GOLD
  • NZDCAD
  • NZDCHF
  • NZDJPY
  • NZDUSD
  • SILVER
  • USDCAD
  • USDCHF
  • USDJPY
  • USDRUB
Таймфрейм
  • Все
  • M5
  • M15
  • M30
  • H1
  • D1
Тренд
  • Все
  • Покупка
  • Продажа
Сила сигнала
  • Все
  • 1
  • 2
  • 3
  • 4
  • 5
Bullish Rectangle
was formed on 07.05 at 09:17:35 (UTC+0)
signal strength 2 of 5
Bullish Rectangle USDCAD M15

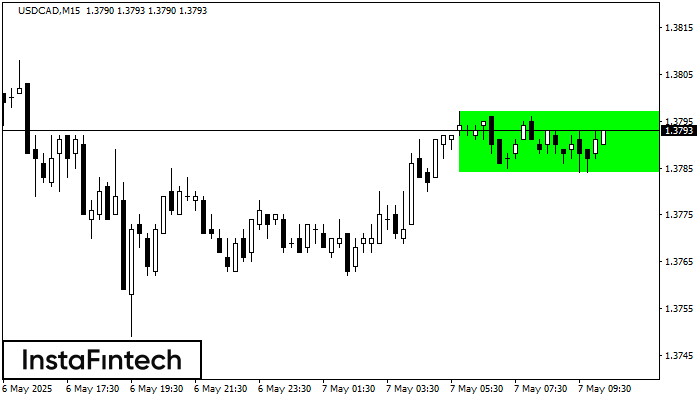
According to the chart of M15, USDCAD formed the Bullish Rectangle. This type of a pattern indicates a trend continuation. It consists of two levels: resistance 1.3797 and support 1.3784

The M5 and M15 time frames may have more false entry points.

Open chart in a new window
Inverse Head and Shoulder
was formed on 07.05 at 08:45:12 (UTC+0)
signal strength 1 of 5
Inverse Head and Shoulder AUDCAD M5

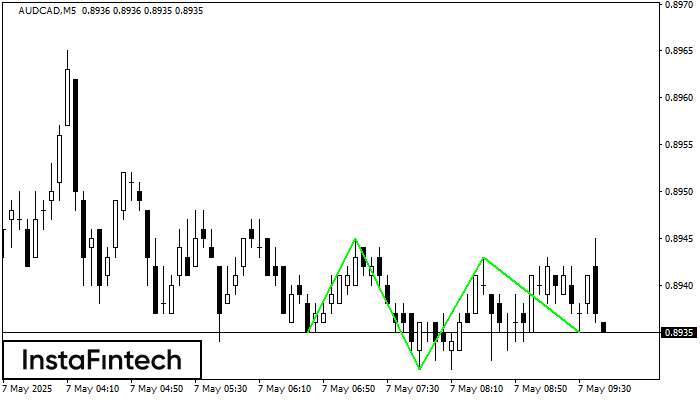
According to the chart of M5, AUDCAD produced the pattern termed the Inverse Head and Shoulder. The Head is fixed at 0.8931 while the median line of the Neck

The M5 and M15 time frames may have more false entry points.

Open chart in a new window
Bearish Rectangle
was formed on 07.05 at 08:33:23 (UTC+0)
signal strength 1 of 5
Bearish Rectangle AUDUSD M5

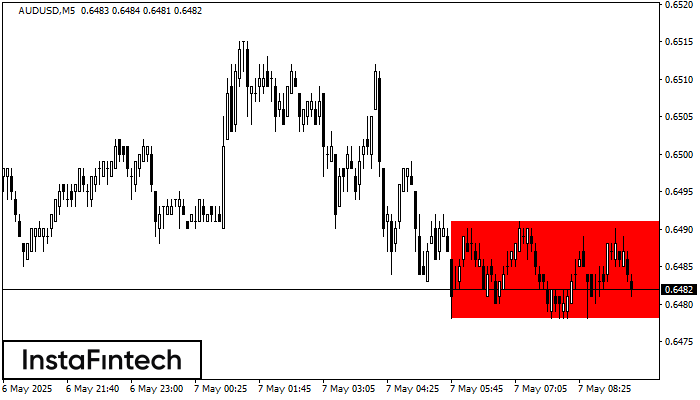
According to the chart of M5, AUDUSD formed the Bearish Rectangle. The pattern indicates a trend continuation. The upper border is 0.6491, the lower border is 0.6478. The signal means

The M5 and M15 time frames may have more false entry points.

Open chart in a new window
Ҳозир телефон орқали гаплаша олмайсизми?
Саволингизни беринг чатда.
Обратный звонок
 

Dear visitor,

Your IP address shows that you are currently located in the USA. If you are a resident of the United States, you are prohibited from using the services of InstaFintech Group including online trading, online transfers, deposit/withdrawal of funds, etc.

If you think you are seeing this message by mistake and your location is not the US, kindly proceed to the website. Otherwise, you must leave the website in order to comply with government restrictions.

Why does your IP address show your location as the USA?

  • - you are using a VPN provided by a hosting company based in the United States;
  • - your IP does not have proper WHOIS records;
  • - an error occurred in the WHOIS geolocation database.

Please confirm whether you are a US resident or not by clicking the relevant button below. If you choose the wrong option, being a US resident, you will not be able to open an account with InstaForex anyway.

We are sorry for any inconvenience caused by this message.