

signal strength 3 of 5
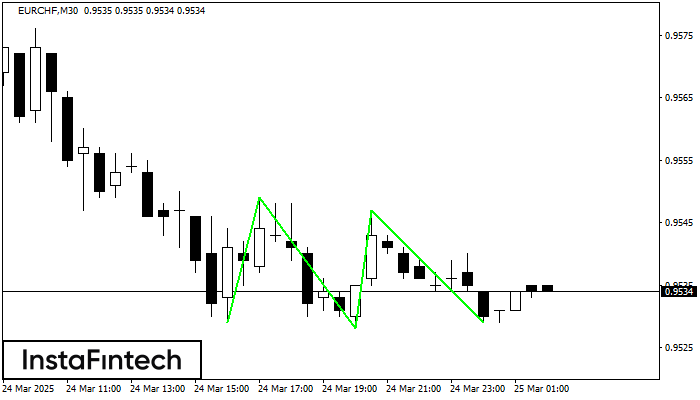
The Triple Bottom pattern has formed on the chart of the EURCHF M30 trading instrument. The pattern signals a change in the trend from downwards to upwards in the case of breakdown of 0.9549/0.9547.
- All
- Double Top
- Flag
- Head and Shoulders
- Pennant
- Rectangle
- Triangle
- Triple top
- All
- #AAPL
- #AMZN
- #Bitcoin
- #EBAY
- #FB
- #GOOG
- #INTC
- #KO
- #MA
- #MCD
- #MSFT
- #NTDOY
- #PEP
- #TSLA
- #TWTR
- AUDCAD
- AUDCHF
- AUDJPY
- AUDUSD
- EURCAD
- EURCHF
- EURGBP
- EURJPY
- EURNZD
- EURRUB
- EURUSD
- GBPAUD
- GBPCHF
- GBPJPY
- GBPUSD
- GOLD
- NZDCAD
- NZDCHF
- NZDJPY
- NZDUSD
- SILVER
- USDCAD
- USDCHF
- USDJPY
- USDRUB
- All
- M5
- M15
- M30
- H1
- D1
- All
- Buy
- Sale
- All
- 1
- 2
- 3
- 4
- 5
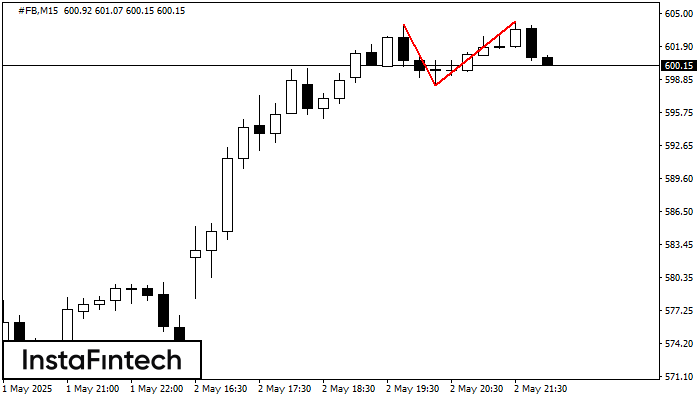
डबल टॉप पैटर्न #FB M15 पर बना है। यह संकेत देता है कि प्रवृत्ति ऊपर से नीचे की ओर बदल गई है। संभवतः, यदि 598.31 पैटर्न का आधार टूट जाता
M5 और M15 समय सीमा में अधिक फाल्स एंट्री पॉइंट्स हो सकते हैं।
Open chart in a new window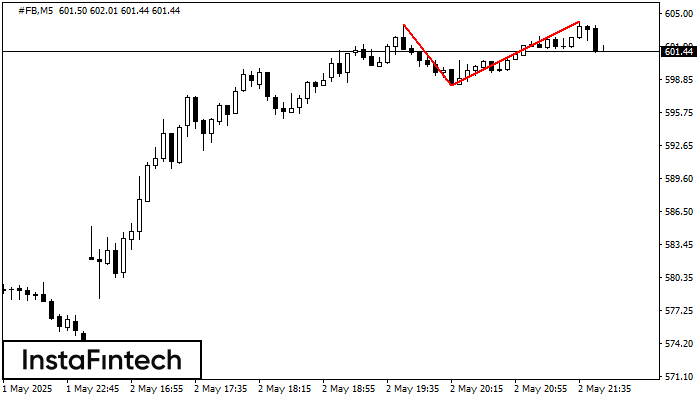
#FB M5 पर डबल टॉप रीवर्सल पैटर्न बना है। विशेषताएं: ऊपरी सीमा 604.00; निचली सीमा 598.31; पैटर्न की चौड़ाई 594 पॉइंट्स है। सेल ट्रेडों को 598.31 की निचली सीमा के
M5 और M15 समय सीमा में अधिक फाल्स एंट्री पॉइंट्स हो सकते हैं।
Open chart in a new window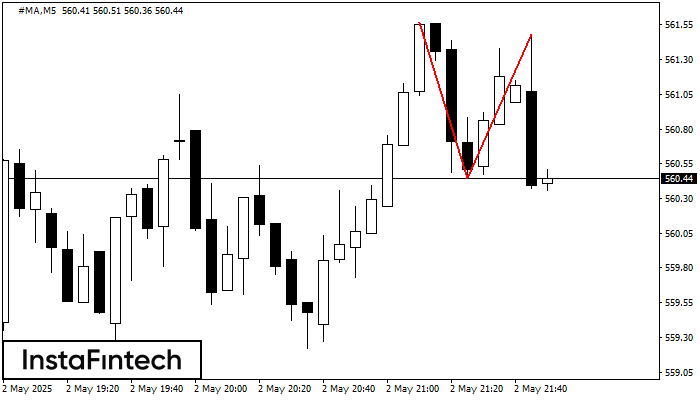
#MA M5 पर डबल टॉप रीवर्सल पैटर्न बना है। विशेषताएं: ऊपरी सीमा 561.57; निचली सीमा 560.44; पैटर्न की चौड़ाई 104 पॉइंट्स है। सेल ट्रेडों को 560.44 की निचली सीमा के
M5 और M15 समय सीमा में अधिक फाल्स एंट्री पॉइंट्स हो सकते हैं।
Open chart in a new window


