


signal strength 1 of 5

According to the chart of M5, GBPAUD formed the Head and Shoulders pattern. The Head’s top is set at 2.0644 while the median line of the Neck is found at 2.0617/2.0613. The formation of the Head and Shoulders pattern evidently signals a reversal of the upward trend. In other words, in case the scenario comes true, the price of GBPAUD will go towards 2.0598.
The M5 and M15 time frames may have more false entry points.
یہ بھی دیکھیں
- All
- Double Top
- Flag
- Head and Shoulders
- Pennant
- Rectangle
- Triangle
- Triple top
- All
- #AAPL
- #AMZN
- #Bitcoin
- #EBAY
- #FB
- #GOOG
- #INTC
- #KO
- #MA
- #MCD
- #MSFT
- #NTDOY
- #PEP
- #TSLA
- #TWTR
- AUDCAD
- AUDCHF
- AUDJPY
- AUDUSD
- EURCAD
- EURCHF
- EURGBP
- EURJPY
- EURNZD
- EURRUB
- EURUSD
- GBPAUD
- GBPCHF
- GBPJPY
- GBPUSD
- GOLD
- NZDCAD
- NZDCHF
- NZDJPY
- NZDUSD
- SILVER
- USDCAD
- USDCHF
- USDJPY
- USDRUB
- All
- M5
- M15
- M30
- H1
- D1
- All
- Buy
- Sale
- All
- 1
- 2
- 3
- 4
- 5
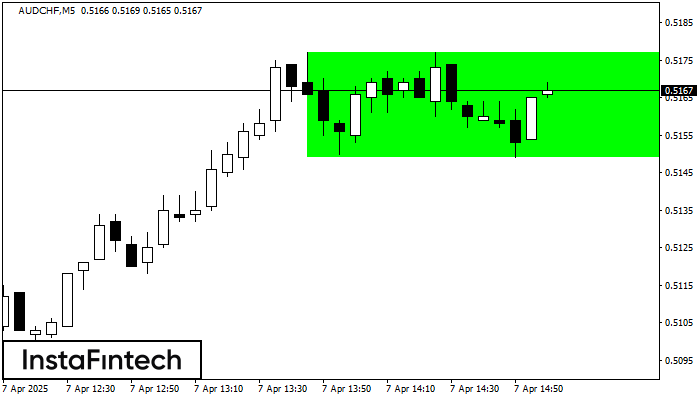
According to the chart of M5, AUDCHF formed the Bullish Rectangle. This type of a pattern indicates a trend continuation. It consists of two levels: resistance 0.5177 and support 0.5149
The M5 and M15 time frames may have more false entry points.
Open chart in a new window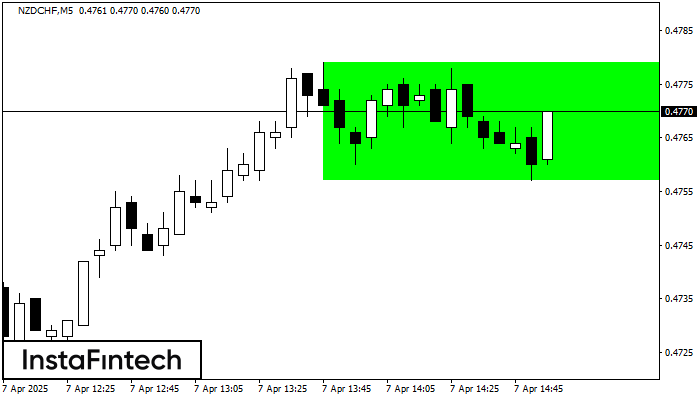
According to the chart of M5, NZDCHF formed the Bullish Rectangle which is a pattern of a trend continuation. The pattern is contained within the following borders: the lower border
The M5 and M15 time frames may have more false entry points.
Open chart in a new window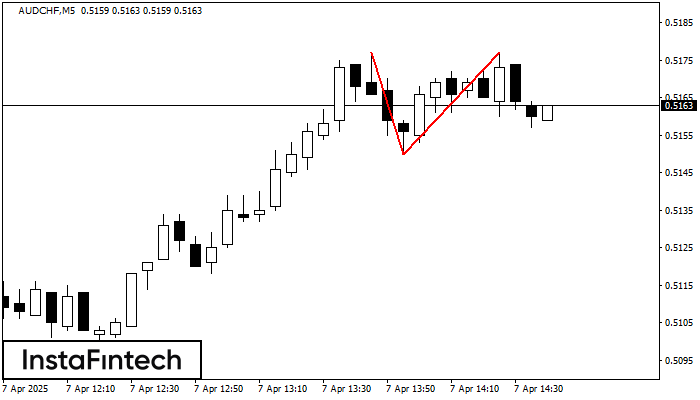
The Double Top pattern has been formed on AUDCHF M5. It signals that the trend has been changed from upwards to downwards. Probably, if the base of the pattern 0.5150
The M5 and M15 time frames may have more false entry points.
Open chart in a new window


