empty
08.11.2023 06:40 AM
EUR/USD and GBP/USD: Technical analysis for November 8

EUR/USD

This image is no longer relevant

Higher Timeframes

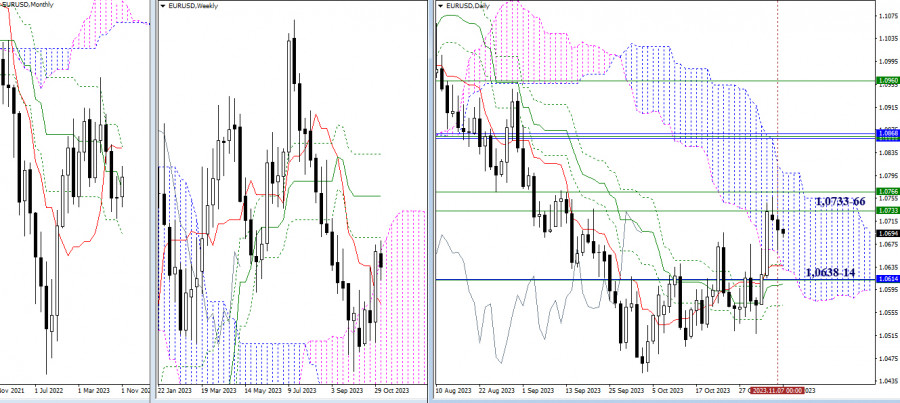
Bears continued the decline yesterday and tested the area of influence of the lower boundary of the daily cloud, but they couldn't hold onto the achieved levels. Today, the situation remains within the limits, with the boundaries being 1.0733 - 1.0766 (weekly levels) and 1.0638 - 1.0614 (daily levels + weekly short-term trend + monthly medium-term trend). A breakdown and a secure consolidation beyond these boundaries will allow us to consider new opportunities and prospects.

This image is no longer relevant

H4 - H1

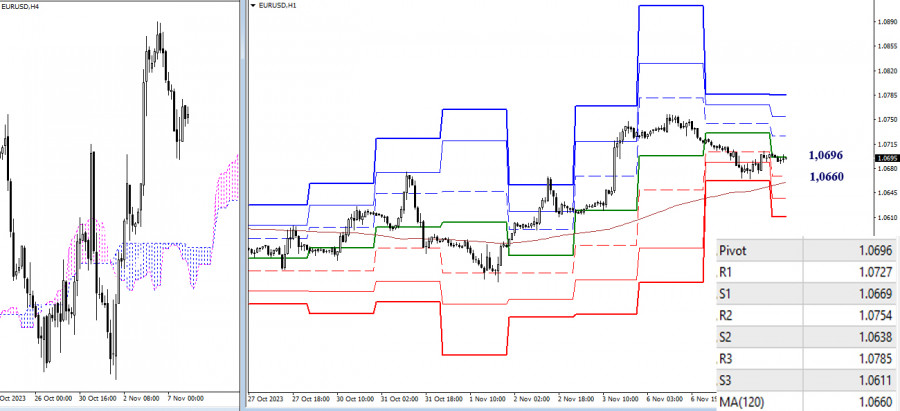
On the lower timeframes, the decline continues, but the market still trades above the weekly long-term trend (1.0660), which continues to favor the bulls. In the case of a recovery of long positions, bullish players may encounter resistance at the classic pivot points (1.0727 - 1.0754 - 1.0785) today. Further decline and a breakdown of the weekly trend (1.0660) will affect the current balance of power, changing preferences towards further strengthening bearish sentiments. Additional intraday support may come from 1.0638 and 1.0611 (support levels of classic pivot points).

***

GBP/USD

This image is no longer relevant

Higher timeframes

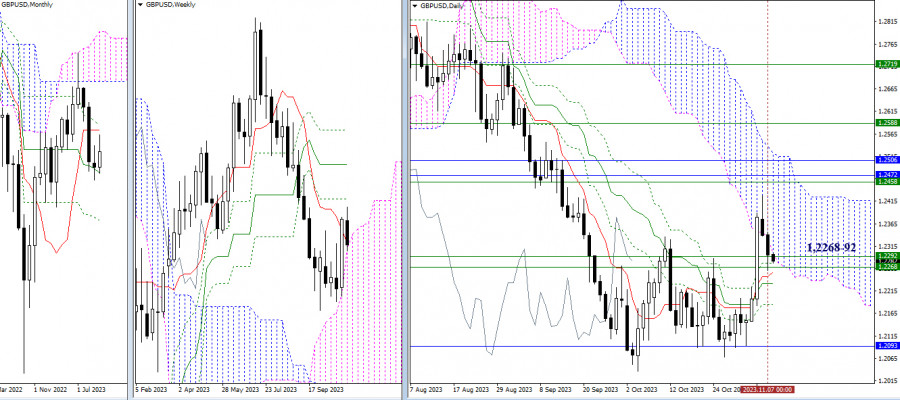
The pound continued its decline and yesterday began to interact with the support area, where the efforts of weekly and daily levels are currently combined (1.2268 - 1.2292). As a result, the most significant task for bearish players at the moment is to break through the zone 1.2268–92 and eliminate the golden cross of the daily Ichimoku cloud at 1.2231 - 1.2185 (final levels). Therefore, in conclusion, the outcome of the current interaction will determine the further development of events in the market.

This image is no longer relevant

H4 - H1

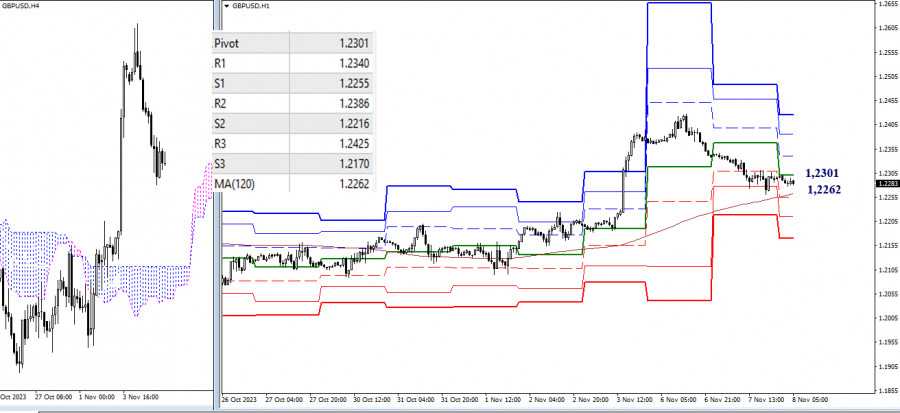
The key levels on the lower timeframes are converging today in the range of 1.2301 - 1.2262 (central pivot point + weekly long-term trend). A breakdown and a reversal of the moving average will help strengthen bearish positions, giving priority to the development of bearish sentiments. Intraday support today can be observed at 1.2255 - 1.2216 - 1.2170 (classic pivot points). A rebound from key levels and the recovery of long positions by bullish players will bring relevance to the resistance levels of the classic pivot points (1.2340 - 1.2386 - 1.2425).

***

The technical analysis of the situation uses:

Higher timeframes - Ichimoku Kinko Hyo (9.26.52) + Fibonacci Kijun levels

Lower timeframes - H1 - Pivot Points (classic) + Moving Average 120 (weekly long-term trend)

Evangelos Poulakis,
Especialista em análise na InstaForex
© 2007-2025
Selecionar intervalo de tempo
5
min
15
min
30
min
1
hora
4
horas
1
dia
1
s.
Ganhe com as variações das taxas das criptomoedas com a InstaForex.
Baixe o MetaTrader 4 e abra a sua primeira operação.
  • Grand Choice
    Contest by
    InstaForex
    InstaForex always strives to help you
    fulfill your biggest dreams.
    PARTICIPE DO CONCURSO

Recommended Stories

GBP/USD – 16 de junho: Os touros mantêm o nível de 1,3527

No gráfico horário, o par GBP/USD na sexta-feira se recuperou duas vezes do nível de retração de Fibonacci de 127,2% em 1,3527 e subiu em direção à zona de resistência

Samir Klishi 16:52 2025-06-16 UTC+2

Análise técnica do movimento diário dos preços do par USD/IDR, segunda-feira, 16 de junho de 2025.

Com o surgimento do padrão Bullish 123, em meio às condições de enfraquecimento deste par de moedas exóticas, e com a confirmação pelo movimento do preço do USD/IDR dentro

Arief Makmur 15:57 2025-06-16 UTC+2

Análise técnica do movimento intradiário dos preços do petróleo bruto, segunda-feira, 16 de junho de 2025

No gráfico de 4 horas do Petróleo Bruto (#CL), podemos observar a formação de uma divergência entre o movimento dos preços do #CL e o indicador Estocástico. Isso indica

Arief Makmur 15:41 2025-06-16 UTC+2

XAU/USD. Análise e previsão

O ouro mantém, no momento, suas perdas intradiárias, pressionado pelo sentimento amplamente positivo nos mercados acionários, que enfraquece a demanda pelo metal precioso. No entanto, uma combinação de fatores impede

Irina Yanina 14:09 2025-06-16 UTC+2

Sinais de negociação para o EUR/USD para 13-19 de junho de 2025: compre acima de 1,1500 (SMA 21 - 7/8 de Murray)

Por outro lado, se o euro cair abaixo de 1,1490, é provável que recue até a EMA 200, situada em 1,1340, região que também coincide com a base do canal

Dimitrios Zappas 15:20 2025-06-13 UTC+2

Sinais de negociação para o OURO para 13-19 de junho de 2025: vender abaixo de 3.343 ( SMA 21 - 8/8 de Murray)

O ouro deixou um gap em 3.282 e outra em torno de 3.181. Portanto, se o preço cair abaixo do nível psicológico de 3.300, poderíamos esperar que ele caísse para

Dimitrios Zappas 15:16 2025-06-13 UTC+2

Previsão para o EUR/USD em 13 de junho de 2025

Na quinta-feira, o par EUR/USD continuou seu movimento ascendente e se consolidou acima do nível de retração de Fibonacci de 100,0% em 1,1574. No entanto, durante a noite, houve

Samir Klishi 14:40 2025-06-13 UTC+2

Previsão para o GBP/USD em 13 de junho de 2025

No gráfico horário, o par GBP/USD na quinta-feira se recuperou do nível 1,3520, subiu para a zona de resistência de 1,3611–1,3620, ricocheteou duas vezes e depois caiu de volta para

Samir Klishi 14:24 2025-06-13 UTC+2

EUR/USD. 12 de junho. Um revés para o dólar

Bom dia, caros traders! Na quarta-feira, o par EUR/USD continuou seu movimento de alta após se recuperar da zona de suporte de 1,1374–1,1380. Ele se consolidou com sucesso acima

Samir Klishi 16:33 2025-06-12 UTC+2
Não pode falar agora?
Faça sua pergunta no chat.
Widget callback
 

Dear visitor,

Your IP address shows that you are currently located in the USA. If you are a resident of the United States, you are prohibited from using the services of InstaFintech Group including online trading, online transfers, deposit/withdrawal of funds, etc.

If you think you are seeing this message by mistake and your location is not the US, kindly proceed to the website. Otherwise, you must leave the website in order to comply with government restrictions.

Why does your IP address show your location as the USA?

  • - you are using a VPN provided by a hosting company based in the United States;
  • - your IP does not have proper WHOIS records;
  • - an error occurred in the WHOIS geolocation database.

Please confirm whether you are a US resident or not by clicking the relevant button below. If you choose the wrong option, being a US resident, you will not be able to open an account with InstaForex anyway.

We are sorry for any inconvenience caused by this message.