

signal strength 2 of 5
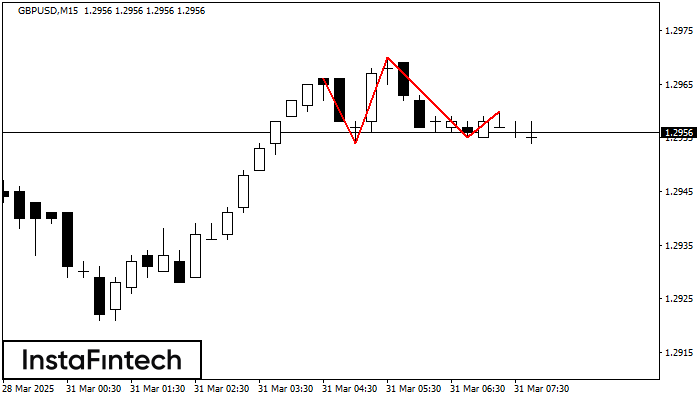
The GBPUSD M15 formed the Head and Shoulders pattern with the following features: The Head’s top is at 1.2970, the Neckline and the upward angle are at 1.2954/1.2955. The formation of this pattern can bring about changes in the current trend from bullish to bearish. In case the pattern triggers the expected changes, the price of GBPUSD will go towards 1.2932.
The M5 and M15 time frames may have more false entry points.
- All
- Double Top
- Flag
- Head and Shoulders
- Pennant
- Rectangle
- Triangle
- Triple top
- All
- #AAPL
- #AMZN
- #Bitcoin
- #EBAY
- #FB
- #GOOG
- #INTC
- #KO
- #MA
- #MCD
- #MSFT
- #NTDOY
- #PEP
- #TSLA
- #TWTR
- AUDCAD
- AUDCHF
- AUDJPY
- AUDUSD
- EURCAD
- EURCHF
- EURGBP
- EURJPY
- EURNZD
- EURRUB
- EURUSD
- GBPAUD
- GBPCHF
- GBPJPY
- GBPUSD
- GOLD
- NZDCAD
- NZDCHF
- NZDJPY
- NZDUSD
- SILVER
- USDCAD
- USDCHF
- USDJPY
- USDRUB
- All
- M5
- M15
- M30
- H1
- D1
- All
- Buy
- Sale
- All
- 1
- 2
- 3
- 4
- 5

O padrão Fundo triplo foi formado no gráfico de AUDCHF M5. Características do padrão: A linha inferior do padrão tem coordenadas 0.5269 com o limite superior 0.5269/0.5268, a projeção
Os intervalos M5 e M15 podem ter mais pontos de entrada falsos.
Open chart in a new window
De acordo com o gráfico de M5, GBPAUD formou o padrão de Triângulo Simétrico de Alta, sinalizando que a tendência continuará. Descrição: O limite superior do padrão toca as coordenadas
Os intervalos M5 e M15 podem ter mais pontos de entrada falsos.
Open chart in a new window
De acordo com o gráfico de M5, #TSLA formou o padrão de Triângulo Simétrico de Baixa. Recomendações de negociação: Uma quebra do limite inferior de 313.81 pode encorajar a continuação
Os intervalos M5 e M15 podem ter mais pontos de entrada falsos.
Open chart in a new window


