

signal strength 2 of 5
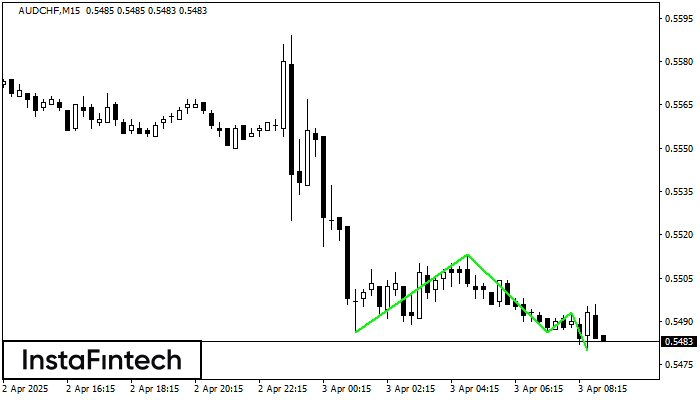
The Triple Bottom pattern has been formed on AUDCHF M15. It has the following characteristics: resistance level 0.5513/0.5493; support level 0.5486/0.5480; the width is 27 points. In the event of a breakdown of the resistance level of 0.5513, the price is likely to continue an upward movement at least to 0.5508.
The M5 and M15 time frames may have more false entry points.
- All
- Double Top
- Flag
- Head and Shoulders
- Pennant
- Rectangle
- Triangle
- Triple top
- All
- #AAPL
- #AMZN
- #Bitcoin
- #EBAY
- #FB
- #GOOG
- #INTC
- #KO
- #MA
- #MCD
- #MSFT
- #NTDOY
- #PEP
- #TSLA
- #TWTR
- AUDCAD
- AUDCHF
- AUDJPY
- AUDUSD
- EURCAD
- EURCHF
- EURGBP
- EURJPY
- EURNZD
- EURRUB
- EURUSD
- GBPAUD
- GBPCHF
- GBPJPY
- GBPUSD
- GOLD
- NZDCAD
- NZDCHF
- NZDJPY
- NZDUSD
- SILVER
- USDCAD
- USDCHF
- USDJPY
- USDRUB
- All
- M5
- M15
- M30
- H1
- D1
- All
- Buy
- Sale
- All
- 1
- 2
- 3
- 4
- 5
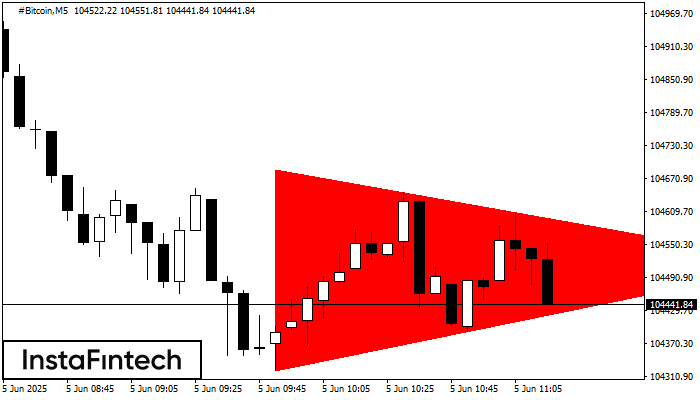
De acordo com o gráfico de M5, #Bitcoin fomrou o padrão de Triângulo Simétrico de Baixa. Este padrão sinaliza uma nova tendência de baixa se o limite inferior 104321.45
Os intervalos M5 e M15 podem ter mais pontos de entrada falsos.
Open chart in a new window
De acordo com o gráfico de M5, SILVER formou o padrão de Triângulo Simétrico de Alta. O limite inferior do padrão toca as coordenadas 34.35/34.45 enquanto o limite superior cruza
Os intervalos M5 e M15 podem ter mais pontos de entrada falsos.
Open chart in a new window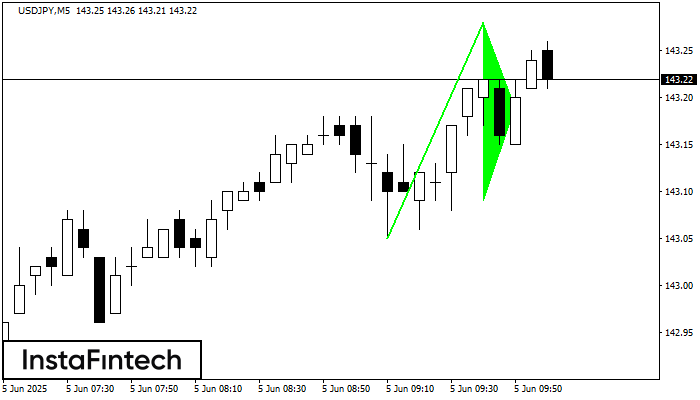
O sinal de Pennant de alta – Instrumento de negociação USDJPY M5, padrão de continuação. Previsão: é possível definir uma posição de compra acima da altura do padrão de 143.28
Os intervalos M5 e M15 podem ter mais pontos de entrada falsos.
Open chart in a new window


