


signal strength 1 of 5
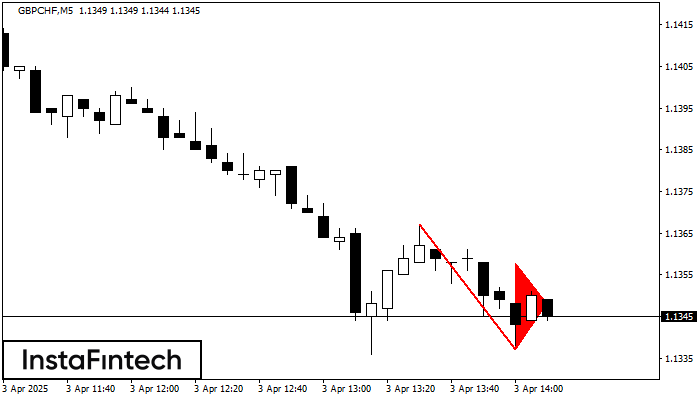
The Bearish pennant pattern has formed on the GBPCHF M5 chart. The pattern signals continuation of the downtrend in case the pennant’s low of 1.1337 is broken through. Recommendations: Place the sell stop pending order 10 pips below the pattern’s low. Place the take profit order at the projection distance of the flagpole height.
The M5 and M15 time frames may have more false entry points.
- All
- Double Top
- Flag
- Head and Shoulders
- Pennant
- Rectangle
- Triangle
- Triple top
- All
- #AAPL
- #AMZN
- #Bitcoin
- #EBAY
- #FB
- #GOOG
- #INTC
- #KO
- #MA
- #MCD
- #MSFT
- #NTDOY
- #PEP
- #TSLA
- #TWTR
- AUDCAD
- AUDCHF
- AUDJPY
- AUDUSD
- EURCAD
- EURCHF
- EURGBP
- EURJPY
- EURNZD
- EURRUB
- EURUSD
- GBPAUD
- GBPCHF
- GBPJPY
- GBPUSD
- GOLD
- NZDCAD
- NZDCHF
- NZDJPY
- NZDUSD
- SILVER
- USDCAD
- USDCHF
- USDJPY
- USDRUB
- All
- M5
- M15
- M30
- H1
- D1
- All
- Buy
- Sale
- All
- 1
- 2
- 3
- 4
- 5
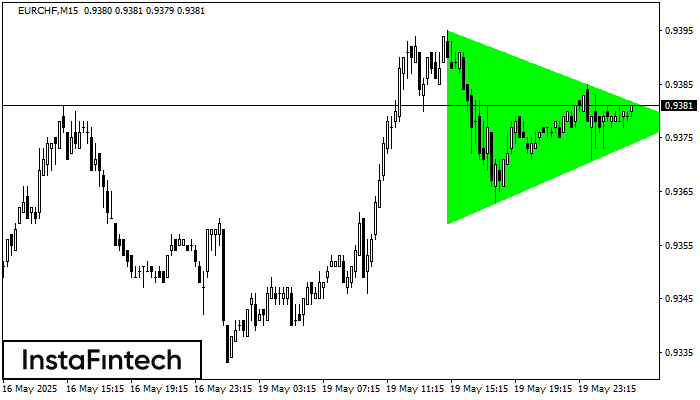
De acordo com o gráfico de M15, EURCHF formaram o padrão de Triângulo Simétrico de Alta. Descrição: Este é o padrão de uma continuação de tendência. 0.9395 e 0.9359
Os intervalos M5 e M15 podem ter mais pontos de entrada falsos.
Open chart in a new window
O padrão Topo duplo foi formado em NZDJPY M15. Isso sinaliza que a tendência foi alterada de cima para baixo. Provavelmente, se a base do padrão 85.75 for quebrada
Os intervalos M5 e M15 podem ter mais pontos de entrada falsos.
Open chart in a new window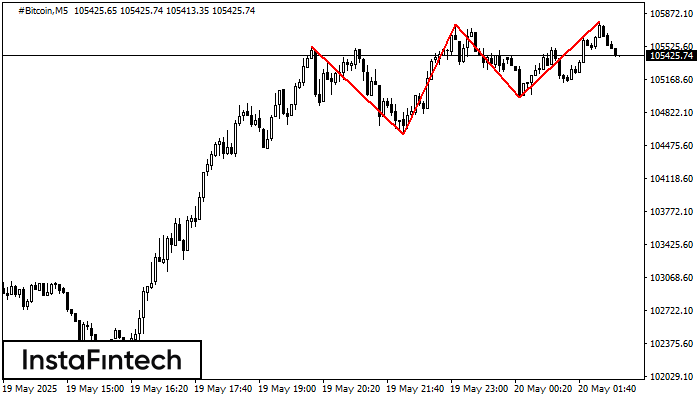
O padrão Topo triplo se formou no gráfico de #Bitcoin M5. Características do padrão: os limites têm um ângulo ascendente; a linha inferior do padrão tem as coordenadas 104587.78/104983.17
Os intervalos M5 e M15 podem ter mais pontos de entrada falsos.
Open chart in a new window


