


signal strength 1 of 5

According to the chart of M5, #MCD formed the Bearish Symmetrical Triangle pattern. Description: The lower border is 290.72/297.52 and upper border is 306.36/297.52. The pattern width is measured on the chart at -1564 pips. The formation of the Bearish Symmetrical Triangle pattern evidently signals a continuation of the downward trend. In other words, if the scenario comes true and #MCD breaches the lower border, the price could continue its move toward 297.37.
The M5 and M15 time frames may have more false entry points.
Veja também
- All
- Double Top
- Flag
- Head and Shoulders
- Pennant
- Rectangle
- Triangle
- Triple top
- All
- #AAPL
- #AMZN
- #Bitcoin
- #EBAY
- #FB
- #GOOG
- #INTC
- #KO
- #MA
- #MCD
- #MSFT
- #NTDOY
- #PEP
- #TSLA
- #TWTR
- AUDCAD
- AUDCHF
- AUDJPY
- AUDUSD
- EURCAD
- EURCHF
- EURGBP
- EURJPY
- EURNZD
- EURRUB
- EURUSD
- GBPAUD
- GBPCHF
- GBPJPY
- GBPUSD
- GOLD
- NZDCAD
- NZDCHF
- NZDJPY
- NZDUSD
- SILVER
- USDCAD
- USDCHF
- USDJPY
- USDRUB
- All
- M5
- M15
- M30
- H1
- D1
- All
- Buy
- Sale
- All
- 1
- 2
- 3
- 4
- 5
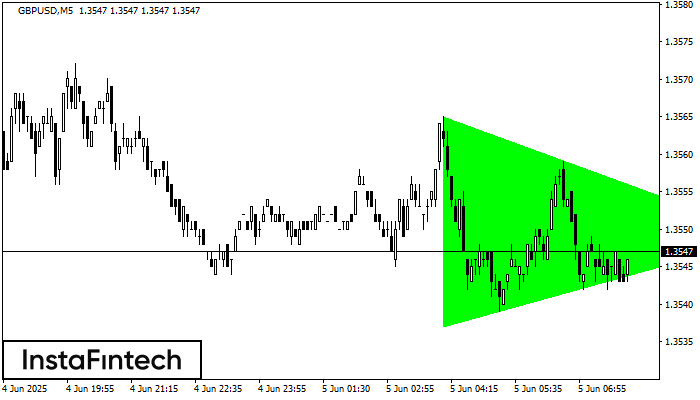
De acordo com o gráfico de M5, GBPUSD formaram o padrão de Triângulo Simétrico de Alta. Descrição: Este é o padrão de uma continuação de tendência. 1.3565 e 1.3537
Os intervalos M5 e M15 podem ter mais pontos de entrada falsos.
Open chart in a new window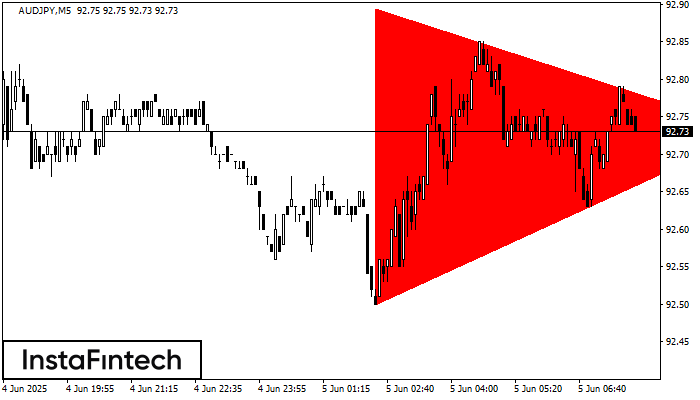
De acordo com o gráfico de M5, AUDJPY formou o padrão de Triângulo Simétrico de Baixa. Recomendações de negociação: Uma quebra do limite inferior de 92.50 pode encorajar a continuação
Os intervalos M5 e M15 podem ter mais pontos de entrada falsos.
Open chart in a new window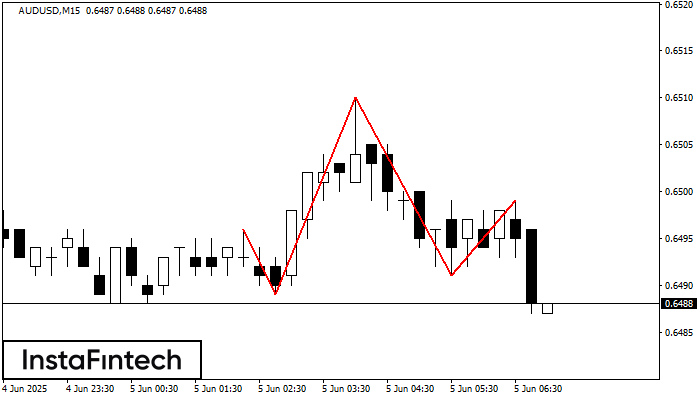
De acordo com o gráfico de M15, AUDUSD formou o padrão Cabeça & Ombros. O topo da Cabeça está definido em 0.6510 enquanto a linha mediana do Pescoço é encontrada
Os intervalos M5 e M15 podem ter mais pontos de entrada falsos.
Open chart in a new window


