


signal strength 3 of 5
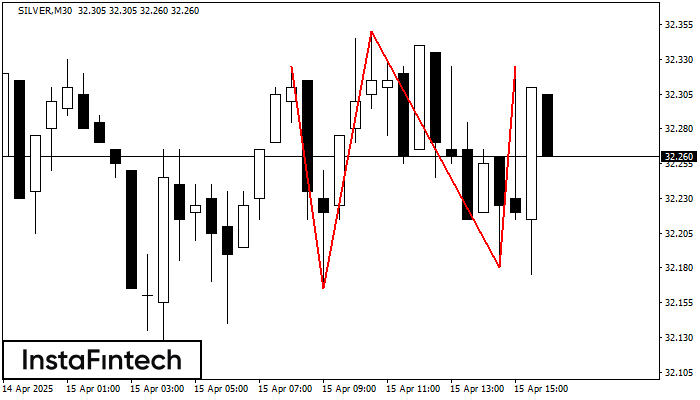
The Triple Top pattern has formed on the chart of the SILVER M30. Features of the pattern: borders have an ascending angle; the lower line of the pattern has the coordinates 32.16/32.18 with the upper limit 32.33/32.33; the projection of the width is 160 points. The formation of the Triple Top figure most likely indicates a change in the trend from upward to downward. This means that in the event of a breakdown of the support level of 32.16, the price is most likely to continue the downward movement.
Veja também
- All
- Double Top
- Flag
- Head and Shoulders
- Pennant
- Rectangle
- Triangle
- Triple top
- All
- #AAPL
- #AMZN
- #Bitcoin
- #EBAY
- #FB
- #GOOG
- #INTC
- #KO
- #MA
- #MCD
- #MSFT
- #NTDOY
- #PEP
- #TSLA
- #TWTR
- AUDCAD
- AUDCHF
- AUDJPY
- AUDUSD
- EURCAD
- EURCHF
- EURGBP
- EURJPY
- EURNZD
- EURRUB
- EURUSD
- GBPAUD
- GBPCHF
- GBPJPY
- GBPUSD
- GOLD
- NZDCAD
- NZDCHF
- NZDJPY
- NZDUSD
- SILVER
- USDCAD
- USDCHF
- USDJPY
- USDRUB
- All
- M5
- M15
- M30
- H1
- D1
- All
- Buy
- Sale
- All
- 1
- 2
- 3
- 4
- 5
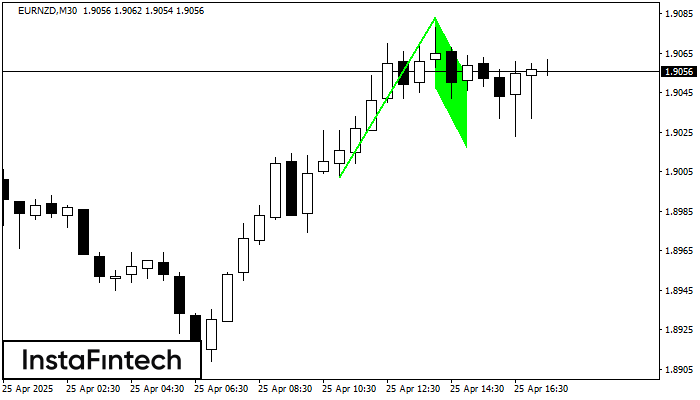
O padrão Bandeira de Alta foi formado no gráfico EURNZD M30, o que sinaliza que a tendência ascendente continuará. Sinais: uma quebra do pico em 1.9083 pode empurrar o preço
Open chart in a new window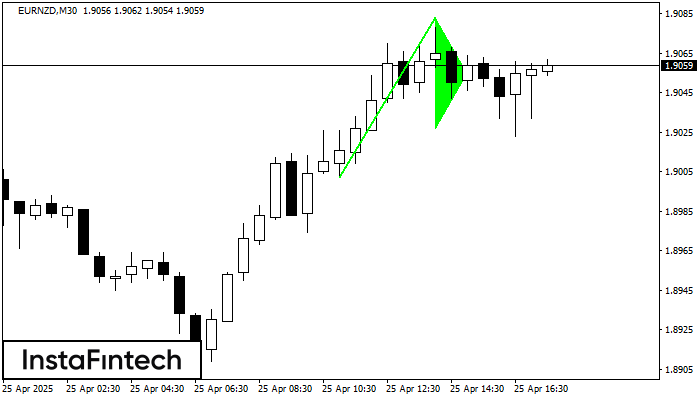
O padrão gráfico Pennant de alta foi formado no instrumento EURNZD M30. Esse tipo de padrão se enquadra na categoria de padrões de continuação. Neste caso, se a cotação conseguir
Open chart in a new window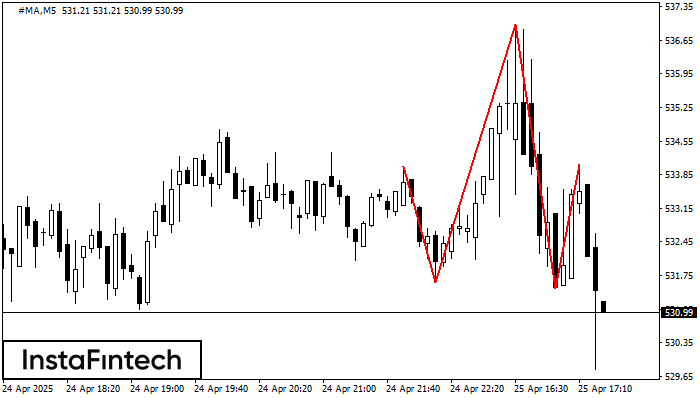
O padrão técnico chamado Cabeça & Ombros apareceu no gráfico de #MA M5. Há razões de peso para sugerir que o preço ultrapassará a Linha do Pescoço 531.61/531.48 após
Os intervalos M5 e M15 podem ter mais pontos de entrada falsos.
Open chart in a new window


