

signal strength 3 of 5

The Bearish pennant pattern has formed on the #NTDOY M30 chart. It signals potential continuation of the existing trend. Specifications: the pattern’s bottom has the coordinate of 16.77; the projection of the flagpole height is equal to 126 pips. In case the price breaks out the pattern’s bottom of 16.77, the downtrend is expected to continue for further level 16.47.
- All
- Double Top
- Flag
- Head and Shoulders
- Pennant
- Rectangle
- Triangle
- Triple top
- All
- #AAPL
- #AMZN
- #Bitcoin
- #EBAY
- #FB
- #GOOG
- #INTC
- #KO
- #MA
- #MCD
- #MSFT
- #NTDOY
- #PEP
- #TSLA
- #TWTR
- AUDCAD
- AUDCHF
- AUDJPY
- AUDUSD
- EURCAD
- EURCHF
- EURGBP
- EURJPY
- EURNZD
- EURRUB
- EURUSD
- GBPAUD
- GBPCHF
- GBPJPY
- GBPUSD
- GOLD
- NZDCAD
- NZDCHF
- NZDJPY
- NZDUSD
- SILVER
- USDCAD
- USDCHF
- USDJPY
- USDRUB
- All
- M5
- M15
- M30
- H1
- D1
- All
- Buy
- Sale
- All
- 1
- 2
- 3
- 4
- 5
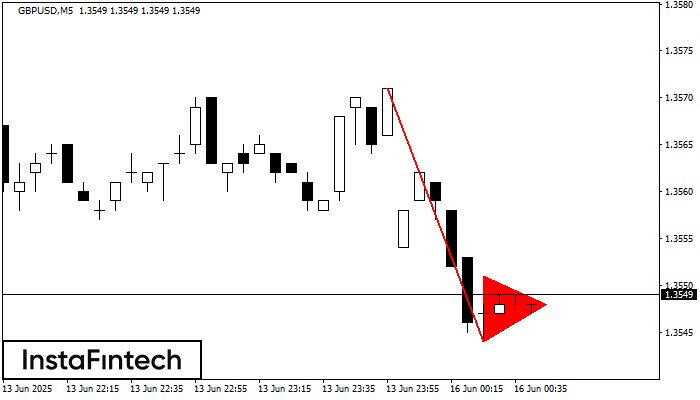
The Bearish pennant pattern has formed on the GBPUSD M5 chart. This pattern type is characterized by a slight slowdown after which the price will move in the direction
The M5 and M15 time frames may have more false entry points.
Open chart in a new window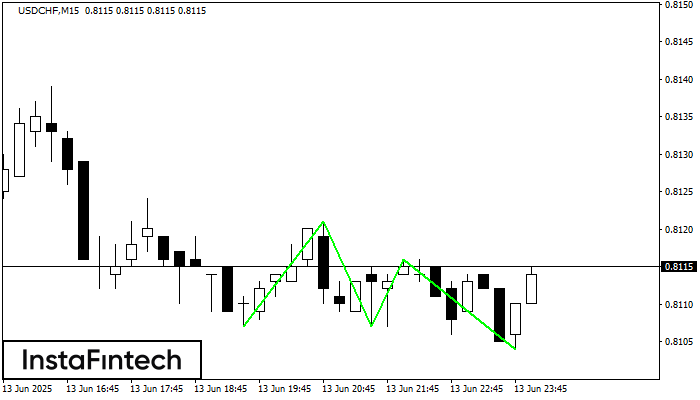
The Triple Bottom pattern has formed on the chart of USDCHF M15. Features of the pattern: The lower line of the pattern has coordinates 0.8121 with the upper limit 0.8121/0.8116
The M5 and M15 time frames may have more false entry points.
Open chart in a new window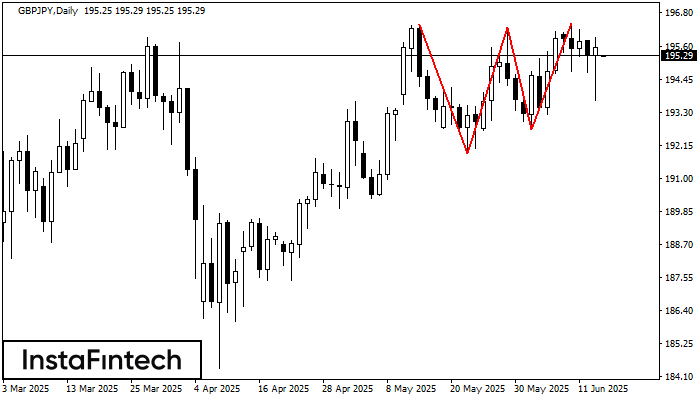
The Triple Top pattern has formed on the chart of the GBPJPY D1. Features of the pattern: borders have an ascending angle; the lower line of the pattern
Open chart in a new window


