

signal strength 1 of 5

The Triple Bottom pattern has been formed on GOLD M5. It has the following characteristics: resistance level 3009.08/2992.38; support level 2976.74/2972.63; the width is 3234 points. In the event of a breakdown of the resistance level of 3009.08, the price is likely to continue an upward movement at least to 2971.02.
The M5 and M15 time frames may have more false entry points.
See Also
- All
- Double Top
- Flag
- Head and Shoulders
- Pennant
- Rectangle
- Triangle
- Triple top
- All
- #AAPL
- #AMZN
- #Bitcoin
- #EBAY
- #FB
- #GOOG
- #INTC
- #KO
- #MA
- #MCD
- #MSFT
- #NTDOY
- #PEP
- #TSLA
- #TWTR
- AUDCAD
- AUDCHF
- AUDJPY
- AUDUSD
- EURCAD
- EURCHF
- EURGBP
- EURJPY
- EURNZD
- EURRUB
- EURUSD
- GBPAUD
- GBPCHF
- GBPJPY
- GBPUSD
- GOLD
- NZDCAD
- NZDCHF
- NZDJPY
- NZDUSD
- SILVER
- USDCAD
- USDCHF
- USDJPY
- USDRUB
- All
- M5
- M15
- M30
- H1
- D1
- All
- Buy
- Sale
- All
- 1
- 2
- 3
- 4
- 5
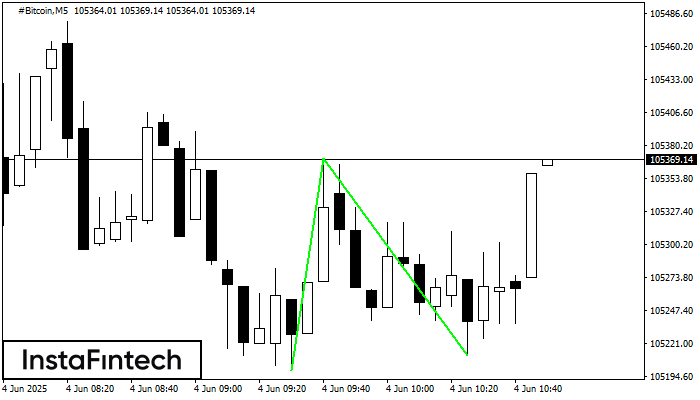
The Double Bottom pattern has been formed on #Bitcoin M5. Characteristics: the support level 105199.24; the resistance level 105369.71; the width of the pattern 17047 points. If the resistance level
The M5 and M15 time frames may have more false entry points.
Open chart in a new window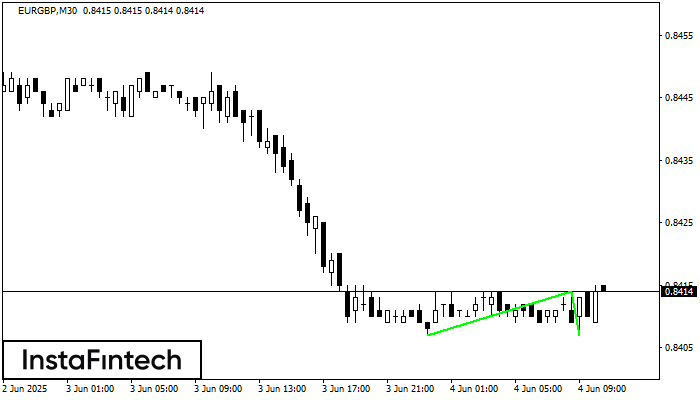
The Double Bottom pattern has been formed on EURGBP M30; the upper boundary is 0.8414; the lower boundary is 0.8407. The width of the pattern is 7 points. In case
Open chart in a new window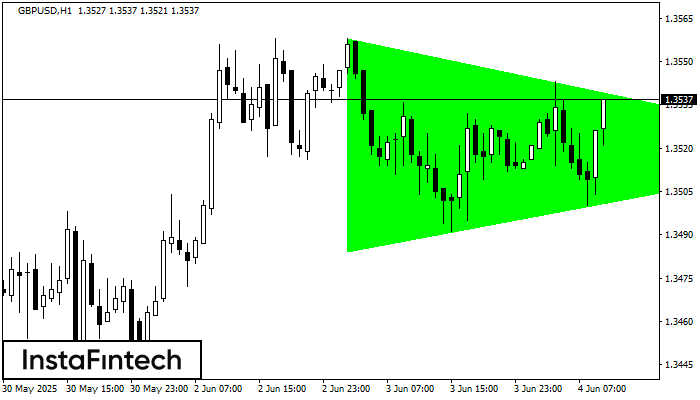
According to the chart of H1, GBPUSD formed the Bullish Symmetrical Triangle pattern. The lower border of the pattern touches the coordinates 1.3484/1.3519 whereas the upper border goes across 1.3558/1.3519
Open chart in a new window


