

signal strength 1 of 5
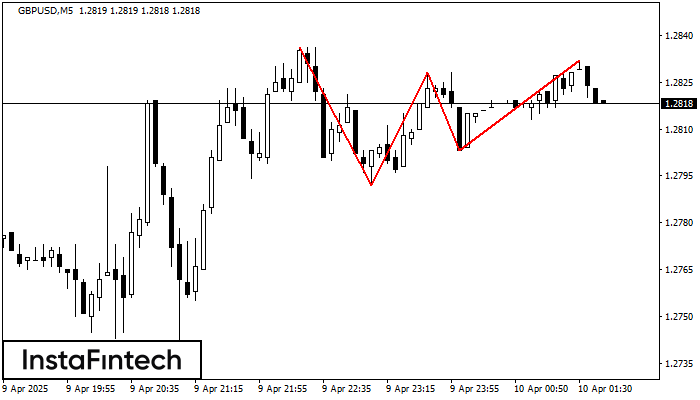
On the chart of the GBPUSD M5 trading instrument, the Triple Top pattern that signals a trend change has formed. It is possible that after formation of the third peak, the price will try to break through the resistance level 1.2792, where we advise to open a trading position for sale. Take profit is the projection of the pattern’s width, which is 44 points.
The M5 and M15 time frames may have more false entry points.
See Also
- All
- Double Top
- Flag
- Head and Shoulders
- Pennant
- Rectangle
- Triangle
- Triple top
- All
- #AAPL
- #AMZN
- #Bitcoin
- #EBAY
- #FB
- #GOOG
- #INTC
- #KO
- #MA
- #MCD
- #MSFT
- #NTDOY
- #PEP
- #TSLA
- #TWTR
- AUDCAD
- AUDCHF
- AUDJPY
- AUDUSD
- EURCAD
- EURCHF
- EURGBP
- EURJPY
- EURNZD
- EURRUB
- EURUSD
- GBPAUD
- GBPCHF
- GBPJPY
- GBPUSD
- GOLD
- NZDCAD
- NZDCHF
- NZDJPY
- NZDUSD
- SILVER
- USDCAD
- USDCHF
- USDJPY
- USDRUB
- All
- M5
- M15
- M30
- H1
- D1
- All
- Buy
- Sale
- All
- 1
- 2
- 3
- 4
- 5
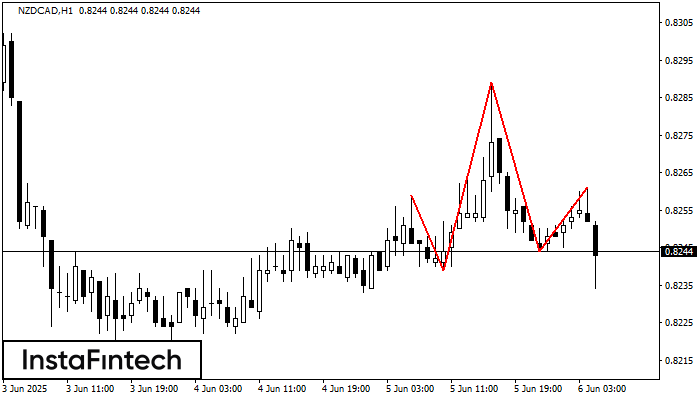
The technical pattern called Head and Shoulders has appeared on the chart of NZDCAD H1. There are weighty reasons to suggest that the price will surpass the Neckline 0.8239/0.8244 after
Open chart in a new window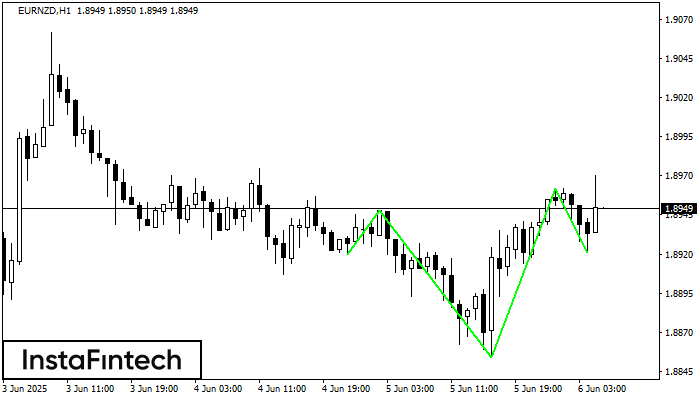
According to H1, EURNZD is shaping the technical pattern – the Inverse Head and Shoulder. In case the Neckline 1.8948/1.8962 is broken out, the instrument is likely to move toward
Open chart in a new window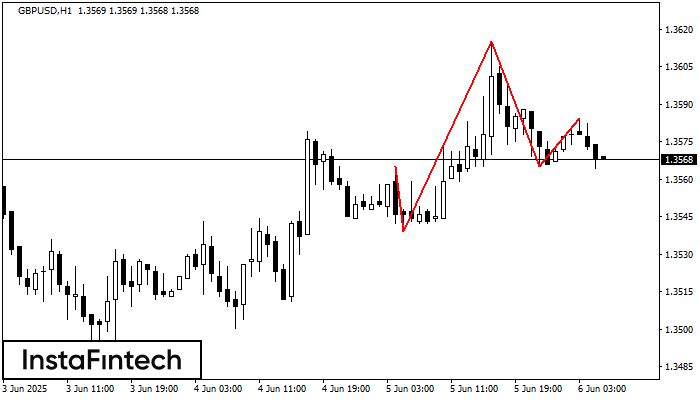
The technical pattern called Head and Shoulders has appeared on the chart of GBPUSD H1. There are weighty reasons to suggest that the price will surpass the Neckline 1.3539/1.3565 after
Open chart in a new window


