

signal strength 2 of 5
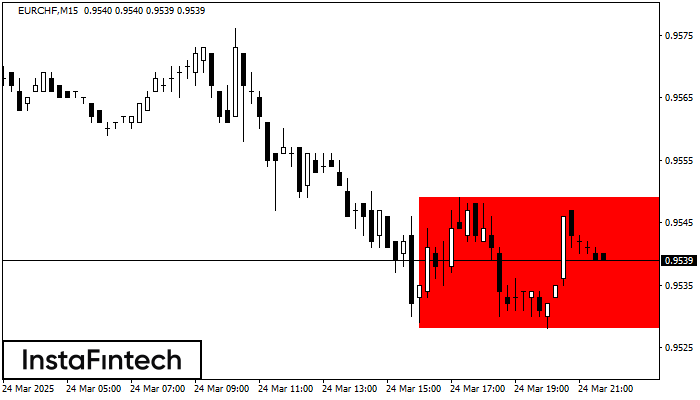
According to the chart of M15, EURCHF formed the Bearish Rectangle which is a pattern of a trend continuation. The pattern is contained within the following borders: lower border 0.9528 – 0.9528 and upper border 0.9549 – 0.9549. In case the lower border is broken, the instrument is likely to follow the downward trend.
The M5 and M15 time frames may have more false entry points.
See Also
- All
- Double Top
- Flag
- Head and Shoulders
- Pennant
- Rectangle
- Triangle
- Triple top
- All
- #AAPL
- #AMZN
- #Bitcoin
- #EBAY
- #FB
- #GOOG
- #INTC
- #KO
- #MA
- #MCD
- #MSFT
- #NTDOY
- #PEP
- #TSLA
- #TWTR
- AUDCAD
- AUDCHF
- AUDJPY
- AUDUSD
- EURCAD
- EURCHF
- EURGBP
- EURJPY
- EURNZD
- EURRUB
- EURUSD
- GBPAUD
- GBPCHF
- GBPJPY
- GBPUSD
- GOLD
- NZDCAD
- NZDCHF
- NZDJPY
- NZDUSD
- SILVER
- USDCAD
- USDCHF
- USDJPY
- USDRUB
- All
- M5
- M15
- M30
- H1
- D1
- All
- Buy
- Sale
- All
- 1
- 2
- 3
- 4
- 5

El patrón Triple Piso ha sido formado en USDCHF H1. Este tiene las siguientes características: nivel de resistencia 0.8256/0.8192; nivel de soporte 0.8140/0.8142; el ancho es 116 puntos. En caso
Open chart in a new window
El patrón Doble Techo ha sido formado en AUDCAD M15. Esto señala que la tendencia ha sido cambiada de alcista a bajista. Probablemente, si la base del patrón 0.8713
Los marcos de tiempo M5 y M15 pueden tener más puntos de entrada falsos.
Open chart in a new window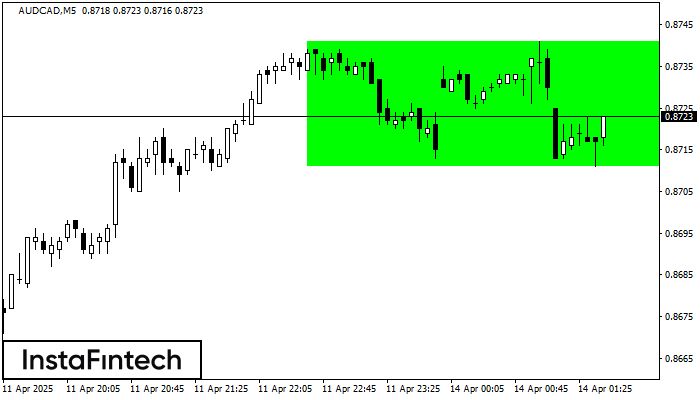
Según el gráfico de M5, AUDCAD formó el Rectángulo Alcista que es un patrón de la continuación de una tendencia. El patrón está contenido dentro de los siguientes límites
Los marcos de tiempo M5 y M15 pueden tener más puntos de entrada falsos.
Open chart in a new window


