


signal strength 3 of 5

The Bearish pennant pattern has formed on the #NTDOY M30 chart. It signals potential continuation of the existing trend. Specifications: the pattern’s bottom has the coordinate of 16.77; the projection of the flagpole height is equal to 126 pips. In case the price breaks out the pattern’s bottom of 16.77, the downtrend is expected to continue for further level 16.47.
- All
- Double Top
- Flag
- Head and Shoulders
- Pennant
- Rectangle
- Triangle
- Triple top
- All
- #AAPL
- #AMZN
- #Bitcoin
- #EBAY
- #FB
- #GOOG
- #INTC
- #KO
- #MA
- #MCD
- #MSFT
- #NTDOY
- #PEP
- #TSLA
- #TWTR
- AUDCAD
- AUDCHF
- AUDJPY
- AUDUSD
- EURCAD
- EURCHF
- EURGBP
- EURJPY
- EURNZD
- EURRUB
- EURUSD
- GBPAUD
- GBPCHF
- GBPJPY
- GBPUSD
- GOLD
- NZDCAD
- NZDCHF
- NZDJPY
- NZDUSD
- SILVER
- USDCAD
- USDCHF
- USDJPY
- USDRUB
- All
- M5
- M15
- M30
- H1
- D1
- All
- Buy
- Sale
- All
- 1
- 2
- 3
- 4
- 5
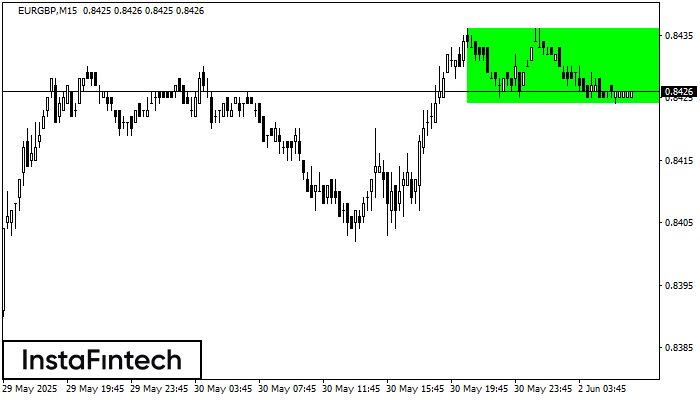
According to the chart of M15, EURGBP formed the Bullish Rectangle. This type of a pattern indicates a trend continuation. It consists of two levels: resistance 0.8436 and support 0.8424
The M5 and M15 time frames may have more false entry points.
Open chart in a new window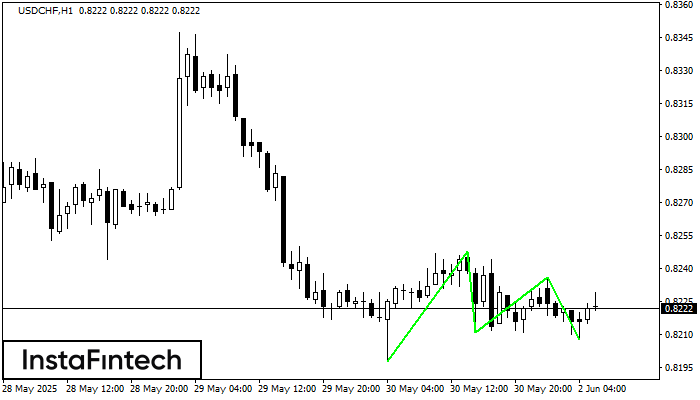
The Triple Bottom pattern has formed on the chart of the USDCHF H1 trading instrument. The pattern signals a change in the trend from downwards to upwards in the case
Open chart in a new window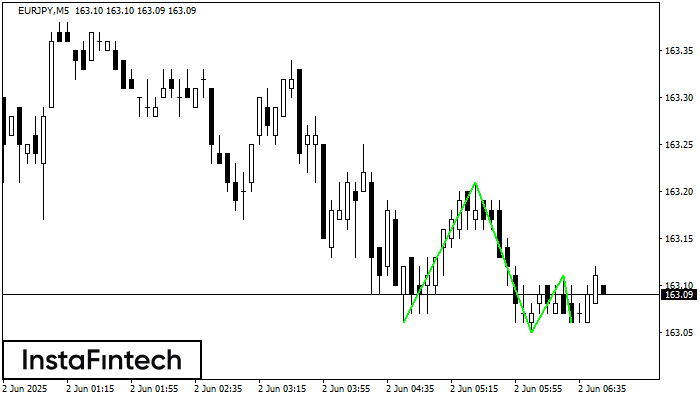
The Triple Bottom pattern has been formed on EURJPY M5. It has the following characteristics: resistance level 163.21/163.11; support level 163.06/163.06; the width is 15 points. In the event
The M5 and M15 time frames may have more false entry points.
Open chart in a new window


