

signal strength 3 of 5
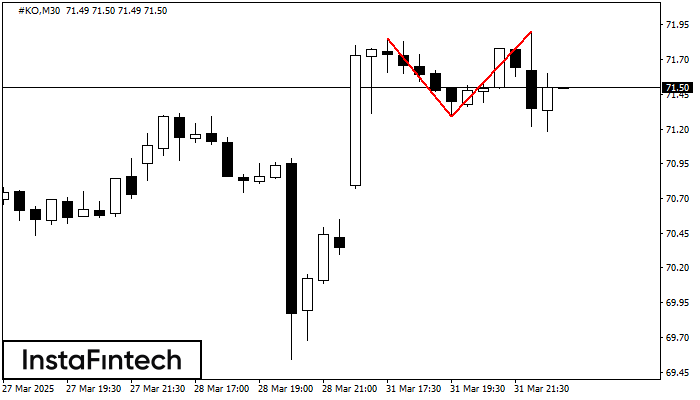
The Double Top reversal pattern has been formed on #KO M30. Characteristics: the upper boundary 71.85; the lower boundary 71.29; the width of the pattern is 61 points. Sell trades are better to be opened below the lower boundary 71.29 with a possible movements towards the 70.99 level.
- All
- Double Top
- Flag
- Head and Shoulders
- Pennant
- Rectangle
- Triangle
- Triple top
- All
- #AAPL
- #AMZN
- #Bitcoin
- #EBAY
- #FB
- #GOOG
- #INTC
- #KO
- #MA
- #MCD
- #MSFT
- #NTDOY
- #PEP
- #TSLA
- #TWTR
- AUDCAD
- AUDCHF
- AUDJPY
- AUDUSD
- EURCAD
- EURCHF
- EURGBP
- EURJPY
- EURNZD
- EURRUB
- EURUSD
- GBPAUD
- GBPCHF
- GBPJPY
- GBPUSD
- GOLD
- NZDCAD
- NZDCHF
- NZDJPY
- NZDUSD
- SILVER
- USDCAD
- USDCHF
- USDJPY
- USDRUB
- All
- M5
- M15
- M30
- H1
- D1
- All
- Buy
- Sale
- All
- 1
- 2
- 3
- 4
- 5
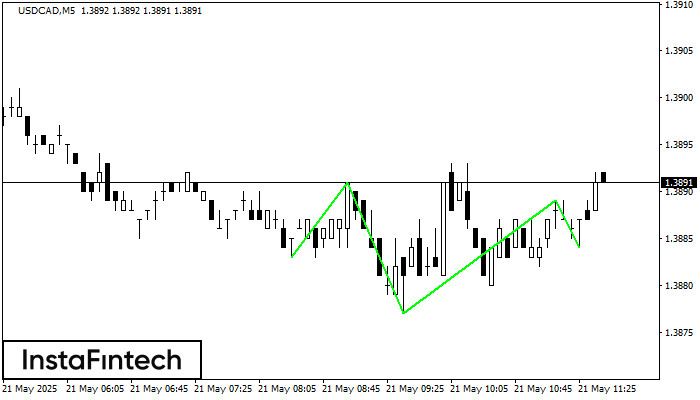
According to the chart of M5, USDCAD formed the Inverse Head and Shoulder pattern. The Head’s top is set at 1.3889 while the median line of the Neck is found
The M5 and M15 time frames may have more false entry points.
Open chart in a new window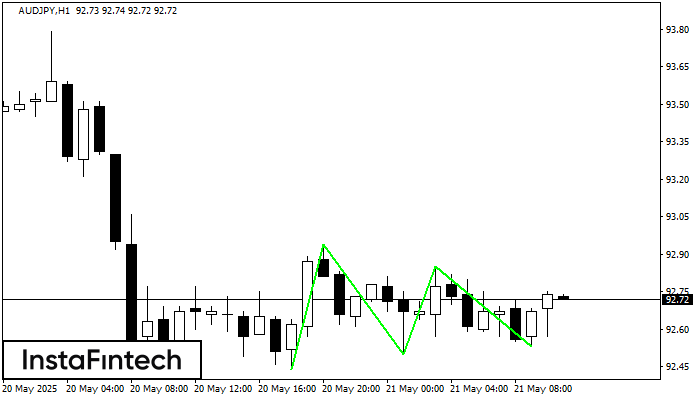
The Triple Bottom pattern has been formed on AUDJPY H1. It has the following characteristics: resistance level 92.94/92.85; support level 92.44/92.53; the width is 50 points. In the event
Open chart in a new window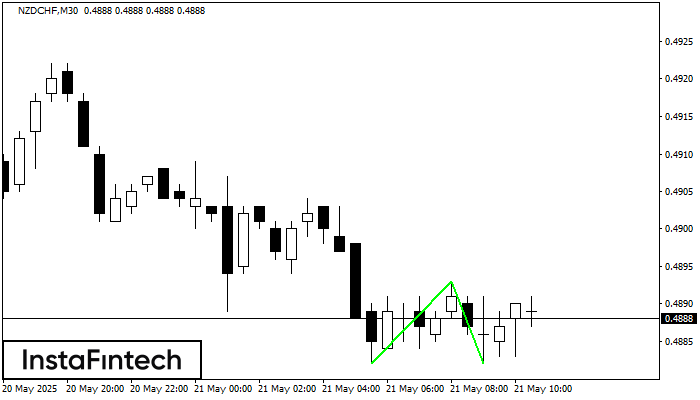
The Double Bottom pattern has been formed on NZDCHF M30. Characteristics: the support level 0.4882; the resistance level 0.4893; the width of the pattern 11 points. If the resistance level
Open chart in a new window


