


signal strength 1 of 5
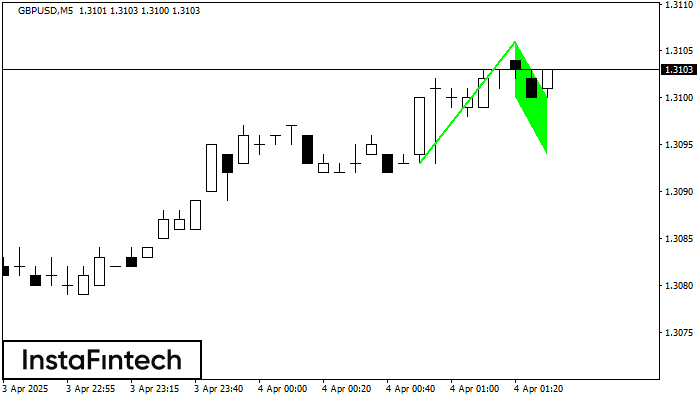
The Bullish Flag pattern has been formed on the chart GBPUSD M5 which signals that the upward trend will continue. Signals: а break of the peak at 1.3106 may push the price higher, and the rise will be the projection of the pole.
The M5 and M15 time frames may have more false entry points.
See Also
- All
- Double Top
- Flag
- Head and Shoulders
- Pennant
- Rectangle
- Triangle
- Triple top
- All
- #AAPL
- #AMZN
- #Bitcoin
- #EBAY
- #FB
- #GOOG
- #INTC
- #KO
- #MA
- #MCD
- #MSFT
- #NTDOY
- #PEP
- #TSLA
- #TWTR
- AUDCAD
- AUDCHF
- AUDJPY
- AUDUSD
- EURCAD
- EURCHF
- EURGBP
- EURJPY
- EURNZD
- EURRUB
- EURUSD
- GBPAUD
- GBPCHF
- GBPJPY
- GBPUSD
- GOLD
- NZDCAD
- NZDCHF
- NZDJPY
- NZDUSD
- SILVER
- USDCAD
- USDCHF
- USDJPY
- USDRUB
- All
- M5
- M15
- M30
- H1
- D1
- All
- Buy
- Sale
- All
- 1
- 2
- 3
- 4
- 5
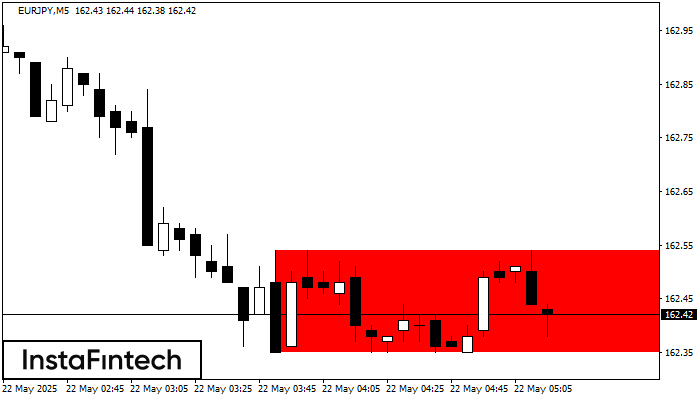
De acordo com o gráfico de M5, EURJPY formou Retângulo de baixa. Este tipo de padrão indica uma continuação da tendência. Ele consiste em dois níveis: resistência 162.54 – 0.00
Os intervalos M5 e M15 podem ter mais pontos de entrada falsos.
Open chart in a new window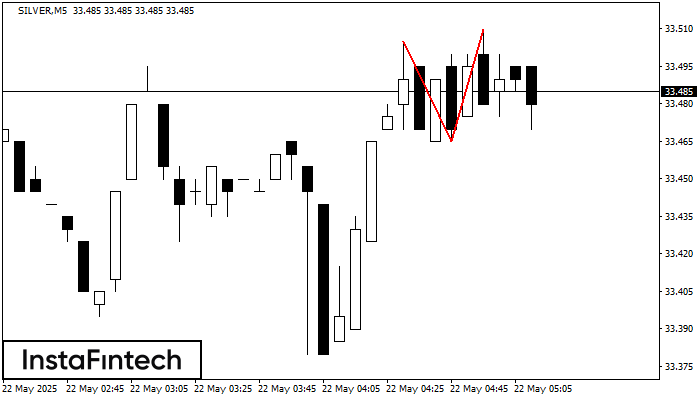
O padrão de reversão Topo duplo foi formado em SILVER M5. Características: o limite superior 33.51; o limite inferior 33.47; a largura do padrão é de 45 pontos. As operações
Os intervalos M5 e M15 podem ter mais pontos de entrada falsos.
Open chart in a new window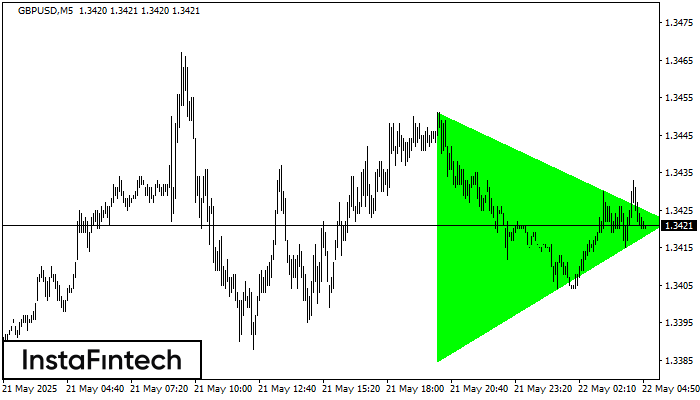
De acordo com o gráfico de M5, GBPUSD formaram o padrão de Triângulo Simétrico de Alta. Descrição: Este é o padrão de uma continuação de tendência. 1.3451 e 1.3385
Os intervalos M5 e M15 podem ter mais pontos de entrada falsos.
Open chart in a new window


