

signal strength 3 of 5
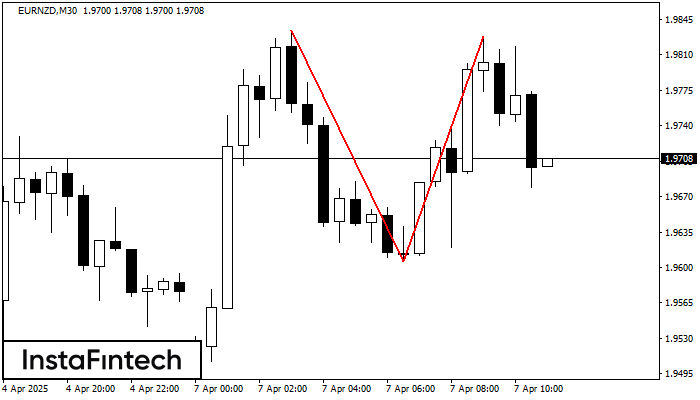
On the chart of EURNZD M30 the Double Top reversal pattern has been formed. Characteristics: the upper boundary 1.9828; the lower boundary 1.9606; the width of the pattern 222 points. The signal: a break of the lower boundary will cause continuation of the downward trend targeting the 1.9576 level.
- All
- Double Top
- Flag
- Head and Shoulders
- Pennant
- Rectangle
- Triangle
- Triple top
- All
- #AAPL
- #AMZN
- #Bitcoin
- #EBAY
- #FB
- #GOOG
- #INTC
- #KO
- #MA
- #MCD
- #MSFT
- #NTDOY
- #PEP
- #TSLA
- #TWTR
- AUDCAD
- AUDCHF
- AUDJPY
- AUDUSD
- EURCAD
- EURCHF
- EURGBP
- EURJPY
- EURNZD
- EURRUB
- EURUSD
- GBPAUD
- GBPCHF
- GBPJPY
- GBPUSD
- GOLD
- NZDCAD
- NZDCHF
- NZDJPY
- NZDUSD
- SILVER
- USDCAD
- USDCHF
- USDJPY
- USDRUB
- All
- M5
- M15
- M30
- H1
- D1
- All
- Buy
- Sale
- All
- 1
- 2
- 3
- 4
- 5

The Double Top pattern has been formed on #TSLA M15. It signals that the trend has been changed from upwards to downwards. Probably, if the base of the pattern 348.76
The M5 and M15 time frames may have more false entry points.
Открыть график инструмента в новом окне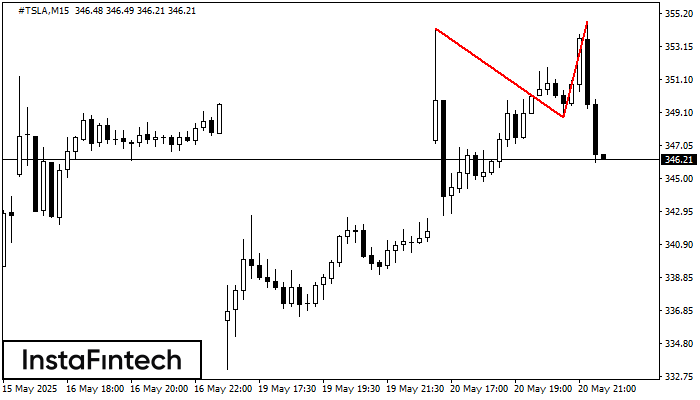
The Double Top reversal pattern has been formed on #TSLA M15. Characteristics: the upper boundary 354.27; the lower boundary 348.76; the width of the pattern is 593 points. Sell trades
The M5 and M15 time frames may have more false entry points.
Открыть график инструмента в новом окне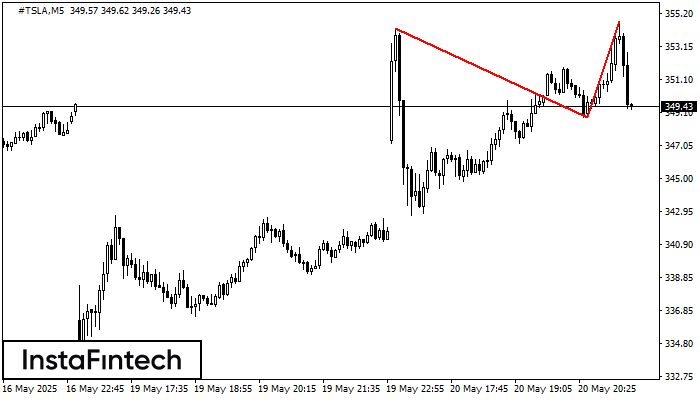
The Double Top pattern has been formed on #TSLA M5. It signals that the trend has been changed from upwards to downwards. Probably, if the base of the pattern 348.76
The M5 and M15 time frames may have more false entry points.
Открыть график инструмента в новом окне


