


signal strength 1 of 5
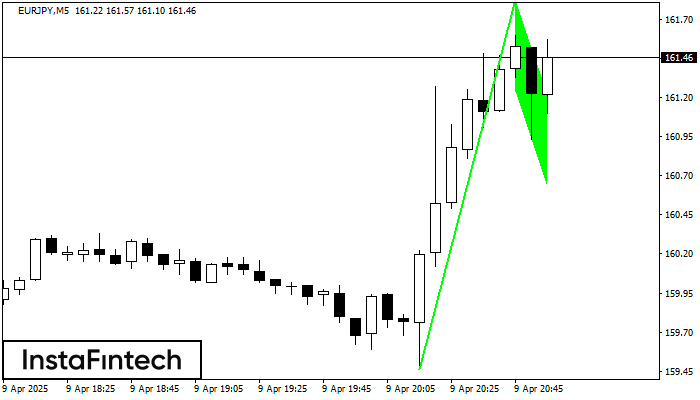
The Bullish Flag pattern has been formed on EURJPY at M5. The lower boundary of the pattern is located at 161.24/160.64, while the higher boundary lies at 161.82/161.22. The projection of the flagpole is 236 points. This formation signals that the upward trend is most likely to continue. Therefore, if the level of 161.82 is broken, the price will move further upwards.
The M5 and M15 time frames may have more false entry points.
- All
- Double Top
- Flag
- Head and Shoulders
- Pennant
- Rectangle
- Triangle
- Triple top
- All
- #AAPL
- #AMZN
- #Bitcoin
- #EBAY
- #FB
- #GOOG
- #INTC
- #KO
- #MA
- #MCD
- #MSFT
- #NTDOY
- #PEP
- #TSLA
- #TWTR
- AUDCAD
- AUDCHF
- AUDJPY
- AUDUSD
- EURCAD
- EURCHF
- EURGBP
- EURJPY
- EURNZD
- EURRUB
- EURUSD
- GBPAUD
- GBPCHF
- GBPJPY
- GBPUSD
- GOLD
- NZDCAD
- NZDCHF
- NZDJPY
- NZDUSD
- SILVER
- USDCAD
- USDCHF
- USDJPY
- USDRUB
- All
- M5
- M15
- M30
- H1
- D1
- All
- Buy
- Sale
- All
- 1
- 2
- 3
- 4
- 5
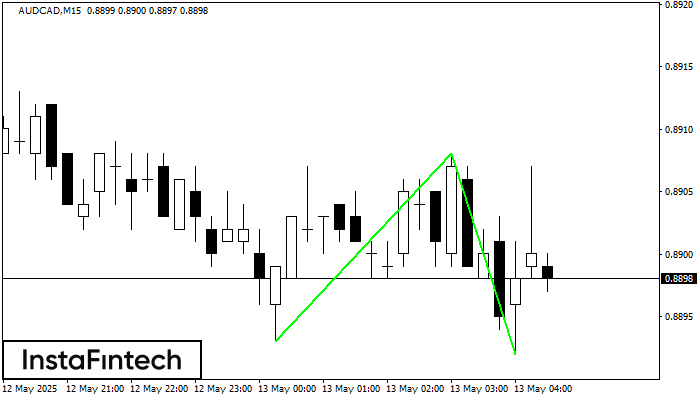
O padrão Fundo duplo foi formado em AUDCAD M15. Esta formação sinaliza uma reversão da tendência de baixo para cima. O sinal é que uma negociação de compra deve
Os intervalos M5 e M15 podem ter mais pontos de entrada falsos.
Open chart in a new window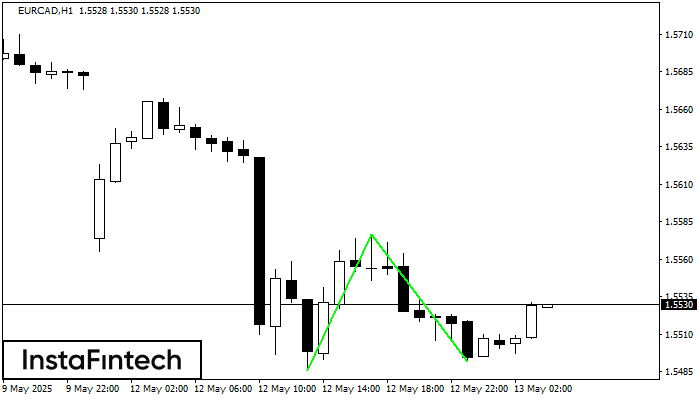
O padrão Fundo duplo foi formado em EURCAD H1; o limite superior é 1.5576; o limite inferior é 1.5492. A largura do padrão é de 90 pontos. No caso
Open chart in a new window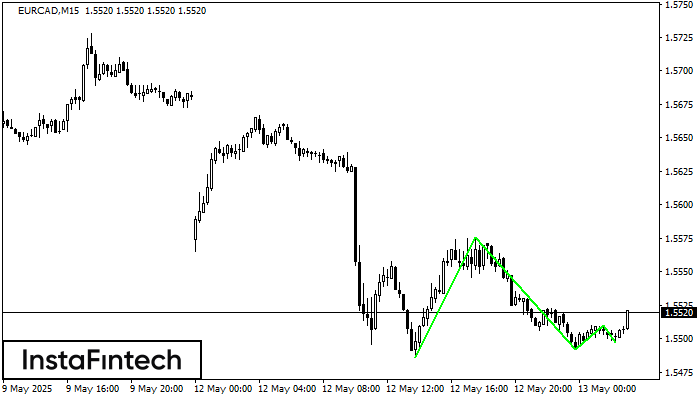
O padrão Fundo triplo foi formado em EURCAD M15. Possui as seguintes características: nível de resistência 1.5576/1.5510; nível de suporte 1.5486/1.5497; a largura é de 90 pontos. Se houver
Os intervalos M5 e M15 podem ter mais pontos de entrada falsos.
Open chart in a new window


