


signal strength 1 of 5
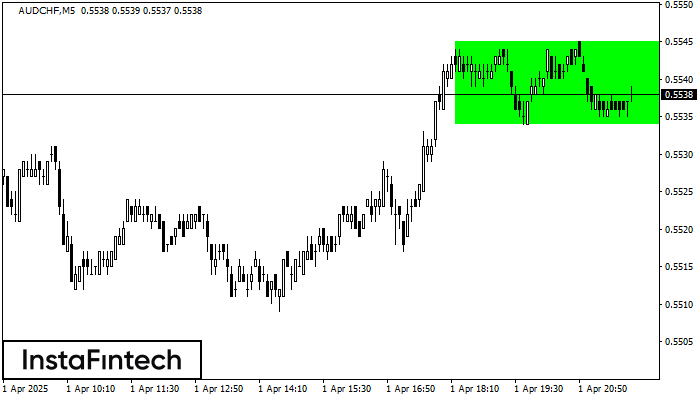
According to the chart of M5, AUDCHF formed the Bullish Rectangle which is a pattern of a trend continuation. The pattern is contained within the following borders: the lower border 0.5534 – 0.5534 and upper border 0.5545 – 0.5545. In case the upper border is broken, the instrument is likely to follow the upward trend.
The M5 and M15 time frames may have more false entry points.
- All
- Double Top
- Flag
- Head and Shoulders
- Pennant
- Rectangle
- Triangle
- Triple top
- All
- #AAPL
- #AMZN
- #Bitcoin
- #EBAY
- #FB
- #GOOG
- #INTC
- #KO
- #MA
- #MCD
- #MSFT
- #NTDOY
- #PEP
- #TSLA
- #TWTR
- AUDCAD
- AUDCHF
- AUDJPY
- AUDUSD
- EURCAD
- EURCHF
- EURGBP
- EURJPY
- EURNZD
- EURRUB
- EURUSD
- GBPAUD
- GBPCHF
- GBPJPY
- GBPUSD
- GOLD
- NZDCAD
- NZDCHF
- NZDJPY
- NZDUSD
- SILVER
- USDCAD
- USDCHF
- USDJPY
- USDRUB
- All
- M5
- M15
- M30
- H1
- D1
- All
- Buy
- Sale
- All
- 1
- 2
- 3
- 4
- 5
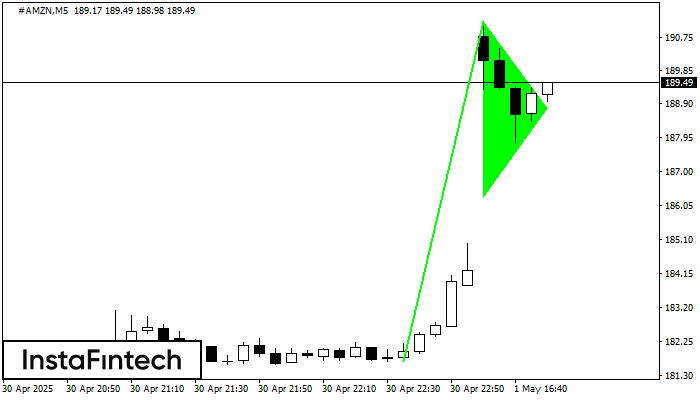
The Bullish pennant graphic pattern has formed on the #AMZN M5 instrument. This pattern type falls under the category of continuation patterns. In this case, if the quote can breaks
The M5 and M15 time frames may have more false entry points.
Open chart in a new window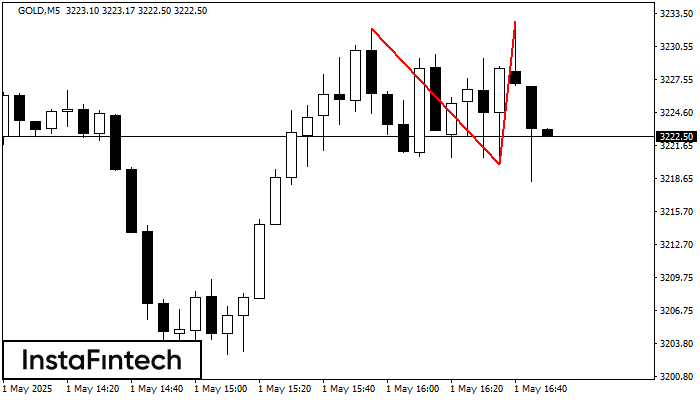
On the chart of GOLD M5 the Double Top reversal pattern has been formed. Characteristics: the upper boundary 3232.80; the lower boundary 3219.90; the width of the pattern 1290 points
The M5 and M15 time frames may have more false entry points.
Open chart in a new window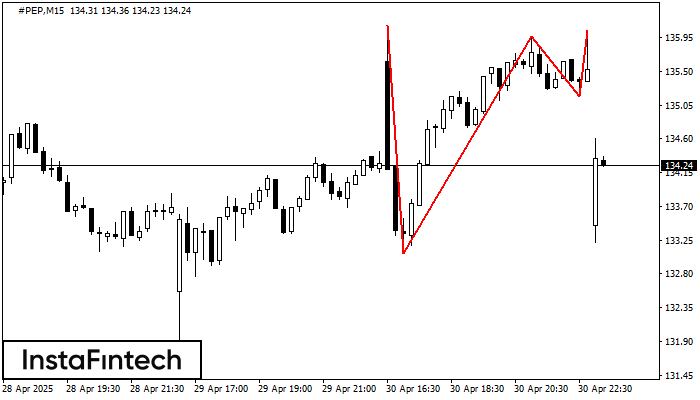
The Triple Top pattern has formed on the chart of the #PEP M15 trading instrument. It is a reversal pattern featuring the following characteristics: resistance level 6, support level -210
The M5 and M15 time frames may have more false entry points.
Open chart in a new window


