


signal strength 2 of 5
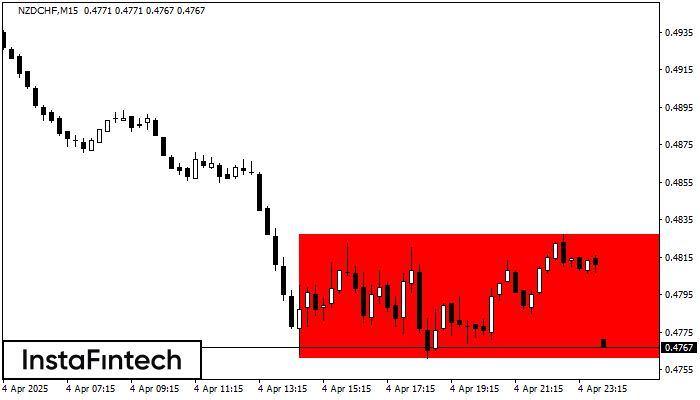
According to the chart of M15, NZDCHF formed the Bearish Rectangle. The pattern indicates a trend continuation. The upper border is 0.4827, the lower border is 0.4761. The signal means that a short position should be opened after fixing a price below the lower border 0.4761 of the Bearish Rectangle.
The M5 and M15 time frames may have more false entry points.
Vea asimismo
- All
- Double Top
- Flag
- Head and Shoulders
- Pennant
- Rectangle
- Triangle
- Triple top
- All
- #AAPL
- #AMZN
- #Bitcoin
- #EBAY
- #FB
- #GOOG
- #INTC
- #KO
- #MA
- #MCD
- #MSFT
- #NTDOY
- #PEP
- #TSLA
- #TWTR
- AUDCAD
- AUDCHF
- AUDJPY
- AUDUSD
- EURCAD
- EURCHF
- EURGBP
- EURJPY
- EURNZD
- EURRUB
- EURUSD
- GBPAUD
- GBPCHF
- GBPJPY
- GBPUSD
- GOLD
- NZDCAD
- NZDCHF
- NZDJPY
- NZDUSD
- SILVER
- USDCAD
- USDCHF
- USDJPY
- USDRUB
- All
- M5
- M15
- M30
- H1
- D1
- All
- Buy
- Sale
- All
- 1
- 2
- 3
- 4
- 5
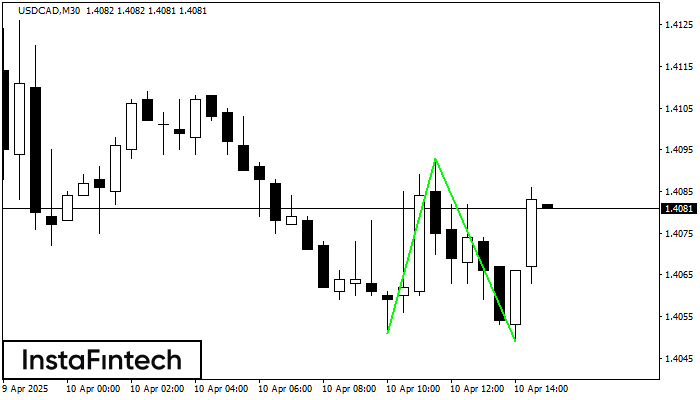
El patrón Doble Piso ha sido formado en USDCAD M30. Esta formación señala una reversión de la tendencia de bajista a alcista. La señal es que se debe abrir
Open chart in a new window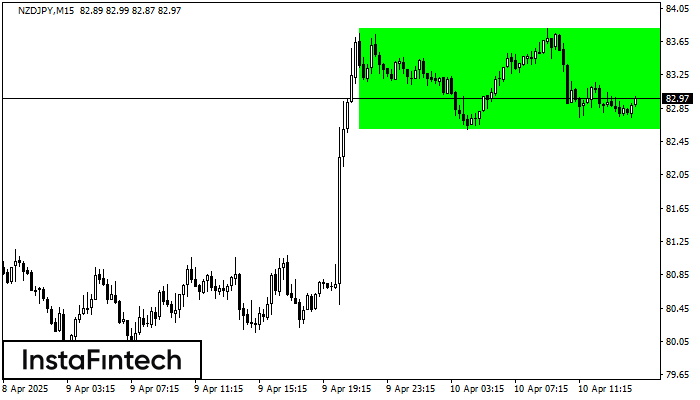
Según el gráfico de M15, NZDJPY formó el Rectángulo Alcista. El patrón indica la continuación de una tendencia. El límite superior es 83.80, el límite inferior es 82.60. La señal
Los marcos de tiempo M5 y M15 pueden tener más puntos de entrada falsos.
Open chart in a new window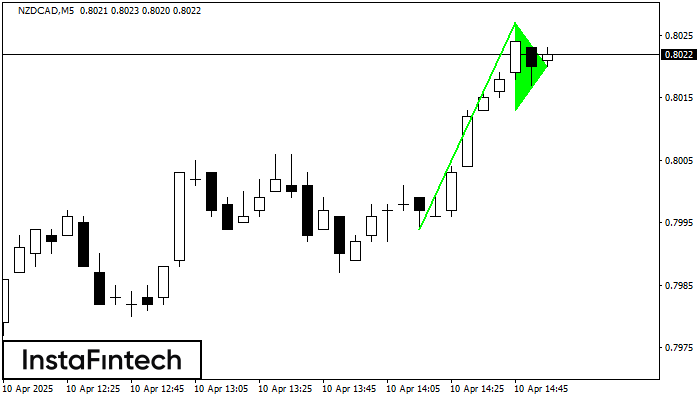
La señal Banderín alcista – Instrumento de negociación NZDCAD M5, patrón de continuación. Pronóstico: es posible establecer una posición de compra por encima del alza del patrón de 0.8027
Los marcos de tiempo M5 y M15 pueden tener más puntos de entrada falsos.
Open chart in a new window


