empty
was formed on 16.04 at 17:05:44 (UTC+0)
signal strength 2 of 5
Bearish pennant #AAPL M15

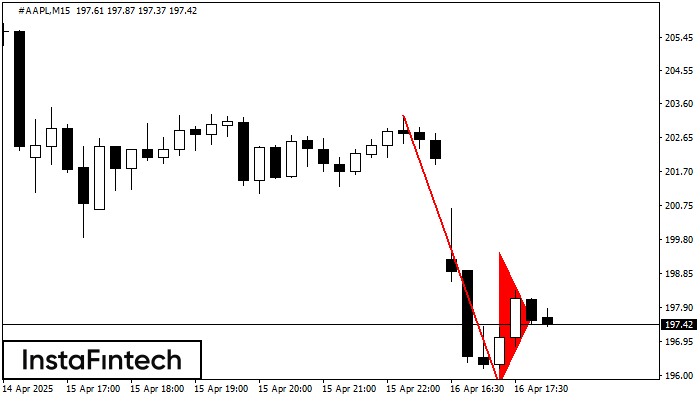
The Bearish pennant pattern has formed on the #AAPL M15 chart. This pattern type is characterized by a slight slowdown after which the price will move in the direction of the original trend. In case the price fixes below the pattern’s low of 195.72, a trader will be able to successfully enter the sell position.

The M5 and M15 time frames may have more false entry points.

Vea asimismo

Figure
  • All
  • Double Top
  • Flag
  • Head and Shoulders
  • Pennant
  • Rectangle
  • Triangle
  • Triple top
Instrument
  • All
  • #AAPL
  • #AMZN
  • #Bitcoin
  • #EBAY
  • #FB
  • #GOOG
  • #INTC
  • #KO
  • #MA
  • #MCD
  • #MSFT
  • #NTDOY
  • #PEP
  • #TSLA
  • #TWTR
  • AUDCAD
  • AUDCHF
  • AUDJPY
  • AUDUSD
  • EURCAD
  • EURCHF
  • EURGBP
  • EURJPY
  • EURNZD
  • EURRUB
  • EURUSD
  • GBPAUD
  • GBPCHF
  • GBPJPY
  • GBPUSD
  • GOLD
  • NZDCAD
  • NZDCHF
  • NZDJPY
  • NZDUSD
  • SILVER
  • USDCAD
  • USDCHF
  • USDJPY
  • USDRUB
Timeframe
  • All
  • M5
  • M15
  • M30
  • H1
  • D1
Trend
  • All
  • Buy
  • Sale
Signal Strength
  • All
  • 1
  • 2
  • 3
  • 4
  • 5
Rectángulo Alcista
was formed on 30.04 at 21:12:49 (UTC+0)
signal strength 4 of 5
Rectángulo Alcista #TSLA H1

Según el gráfico de H1, #TSLA formó el Rectángulo Alcista. Este tipo de patrón indica la continuación de una tendencia. Esto consiste de dos niveles: resistencia 294.59 y soporte 270.55

Open chart in a new window
Rectángulo Alcista
was formed on 30.04 at 21:12:27 (UTC+0)
signal strength 4 of 5
Rectángulo Alcista #TSLA H1

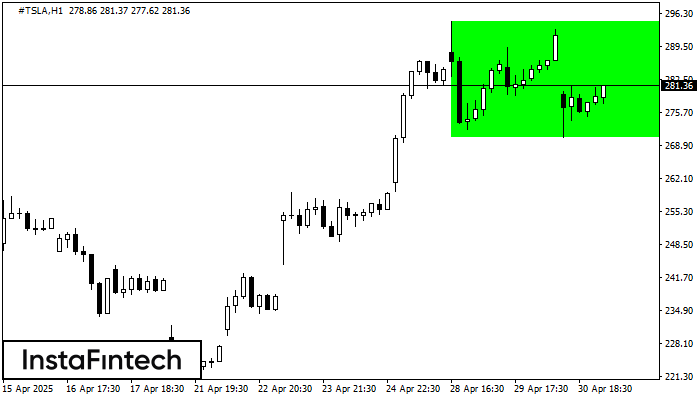
Según el gráfico de H1, #TSLA formó el Rectángulo Alcista. El patrón indica la continuación de una tendencia. El límite superior es 294.59, el límite inferior es 270.55. La señal

Open chart in a new window
Rectángulo Alcista
was formed on 30.04 at 21:12:19 (UTC+0)
signal strength 3 of 5
Rectángulo Alcista #TSLA M30

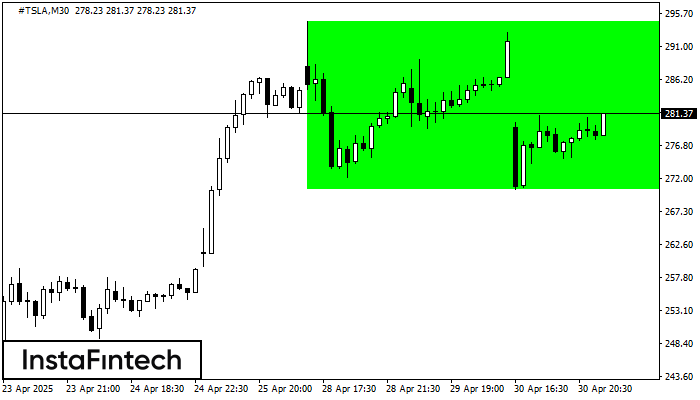
Según el gráfico de M30, #TSLA formó el Rectángulo Alcista. Este tipo de patrón indica la continuación de una tendencia. Esto consiste de dos niveles: resistencia 294.59 y soporte 270.55

Open chart in a new window
¿No puede hablar ahora mismo?
Ingrese su pregunta en el chat.
Widget callback
 

Dear visitor,

Your IP address shows that you are currently located in the USA. If you are a resident of the United States, you are prohibited from using the services of InstaFintech Group including online trading, online transfers, deposit/withdrawal of funds, etc.

If you think you are seeing this message by mistake and your location is not the US, kindly proceed to the website. Otherwise, you must leave the website in order to comply with government restrictions.

Why does your IP address show your location as the USA?

  • - you are using a VPN provided by a hosting company based in the United States;
  • - your IP does not have proper WHOIS records;
  • - an error occurred in the WHOIS geolocation database.

Please confirm whether you are a US resident or not by clicking the relevant button below. If you choose the wrong option, being a US resident, you will not be able to open an account with InstaForex anyway.

We are sorry for any inconvenience caused by this message.