


signal strength 1 of 5
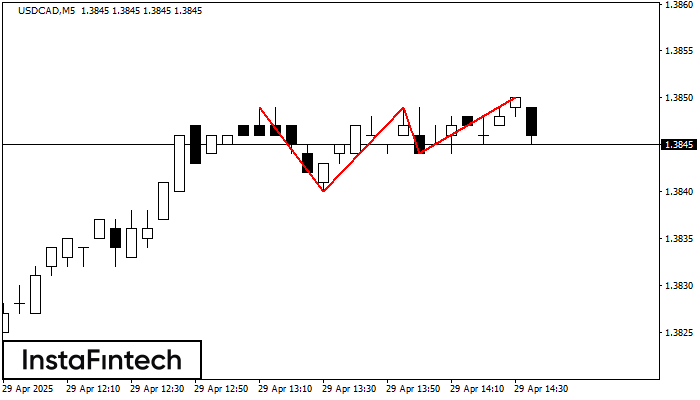
The Triple Top pattern has formed on the chart of the USDCAD M5 trading instrument. It is a reversal pattern featuring the following characteristics: resistance level -1, support level -4, and pattern’s width 9. Forecast If the price breaks through the support level 1.3840, it is likely to move further down to 1.3834.
The M5 and M15 time frames may have more false entry points.
Vea asimismo
- All
- Double Top
- Flag
- Head and Shoulders
- Pennant
- Rectangle
- Triangle
- Triple top
- All
- #AAPL
- #AMZN
- #Bitcoin
- #EBAY
- #FB
- #GOOG
- #INTC
- #KO
- #MA
- #MCD
- #MSFT
- #NTDOY
- #PEP
- #TSLA
- #TWTR
- AUDCAD
- AUDCHF
- AUDJPY
- AUDUSD
- EURCAD
- EURCHF
- EURGBP
- EURJPY
- EURNZD
- EURRUB
- EURUSD
- GBPAUD
- GBPCHF
- GBPJPY
- GBPUSD
- GOLD
- NZDCAD
- NZDCHF
- NZDJPY
- NZDUSD
- SILVER
- USDCAD
- USDCHF
- USDJPY
- USDRUB
- All
- M5
- M15
- M30
- H1
- D1
- All
- Buy
- Sale
- All
- 1
- 2
- 3
- 4
- 5
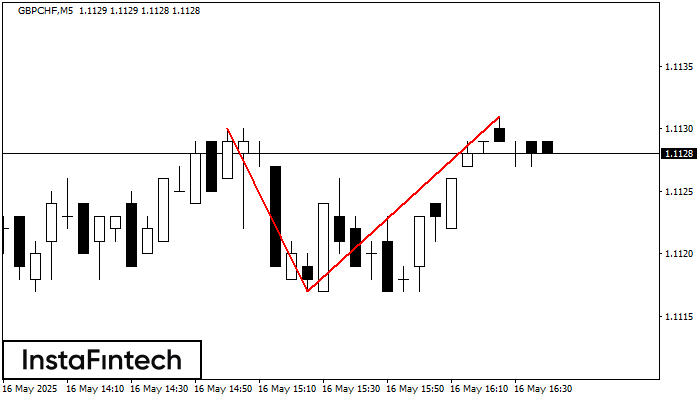
El patrón Doble Techo ha sido formado en GBPCHF M5. Esto señala que la tendencia ha sido cambiada de alcista a bajista. Probablemente, si la base del patrón 1.1117
Los marcos de tiempo M5 y M15 pueden tener más puntos de entrada falsos.
Open chart in a new window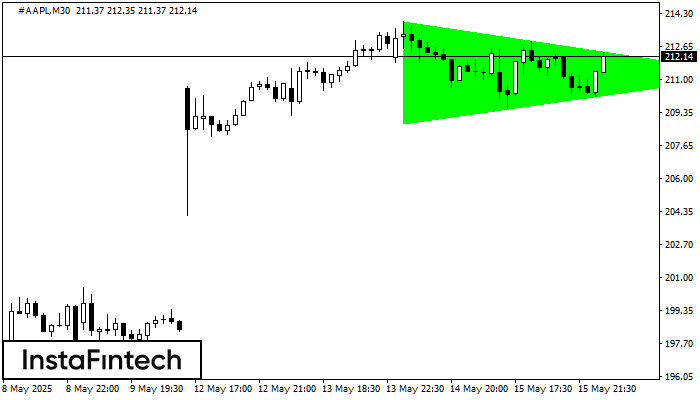
Según el gráfico de M30, el #AAPL formó el patrón Triángulo Simétrico Alcista. El límite inferior del patrón toca las coordenadas 208.80/211.23 donde el límite superior cruza 213.91/211.23
Open chart in a new window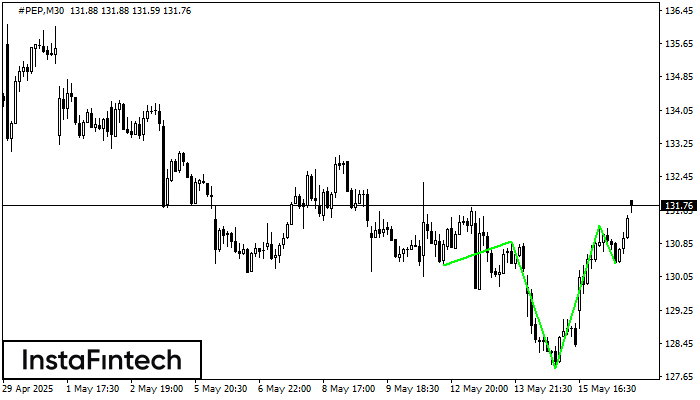
Según M30, #PEP está formando el patrón técnico: el Cabeza y Hombros Inverso. En caso de que la línea de cuello 130.89/131.28 se rompa, es posible que el instrumento
Open chart in a new window


