empty
12.11.2021 11:16 AM
EUR/USD, USD/JPY, GBP/JPY, GOLD simplified wave analysis and forecast on November 12

EUR/USD

Analysis:

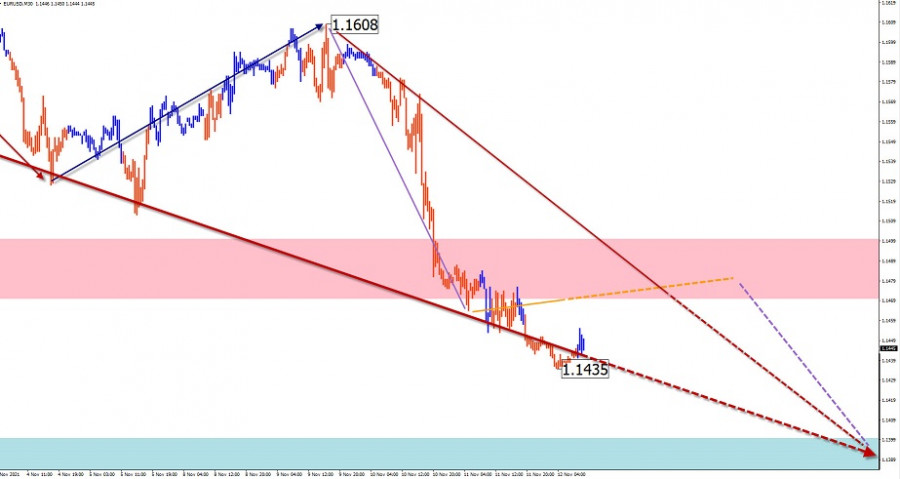
The main direction of the intraday movement of the euro continues to be set by the descending wave from January 6. All counter-movements are within intermediate-term corrections. After breaking through another support, a new section on the main course has started.

Forecast:

A generally flat trading pattern is likely in the coming trading sessions. Short-term price rises are also possible, not beyond the resistance zone. A return to a downtrend is expected at the end of the day or tomorrow.

Potential reversal zones

Resistance:

- 1.1470/1.1500

Support:

- 1.1400/1.1370

Recommendations:

There are no conditions for buying on the euro market today. It is advisable to refrain from entering the market until the completion of the price pullback, with the search for signals to sell the instruments around the calculated resistance.

This image is no longer relevant

USD/JPY

Analysis:

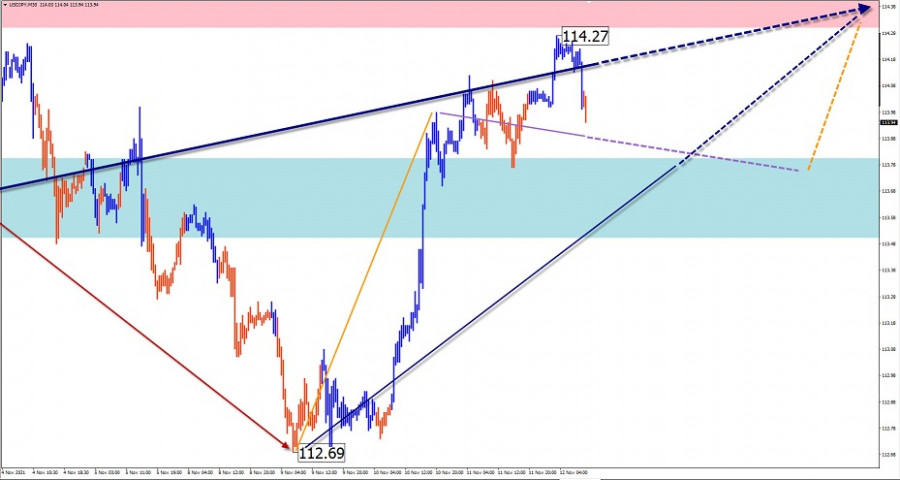
A month-and-a-half-long bearish correction has ended on the Japanese yen major chart. The last leg of the uptrend started on November 9. The price is approaching the lower edge of the wide resistance zone of the upper TF.

Forecast:

In the coming day, the price is expected to move in a narrow range between the opposing zones. After an attempted pressure on the support zone, a change of vector and an upward price move is expected.

Potential reversal zones

Resistance:

- 114.30/114.60

Support:

- 113.80/113.50

Recommendations:

Trading in the Japanese yen market today can be risky. Short-term trades in fractional lots inside the price channel are possible.

This image is no longer relevant

GBP/JPY

Analysis:

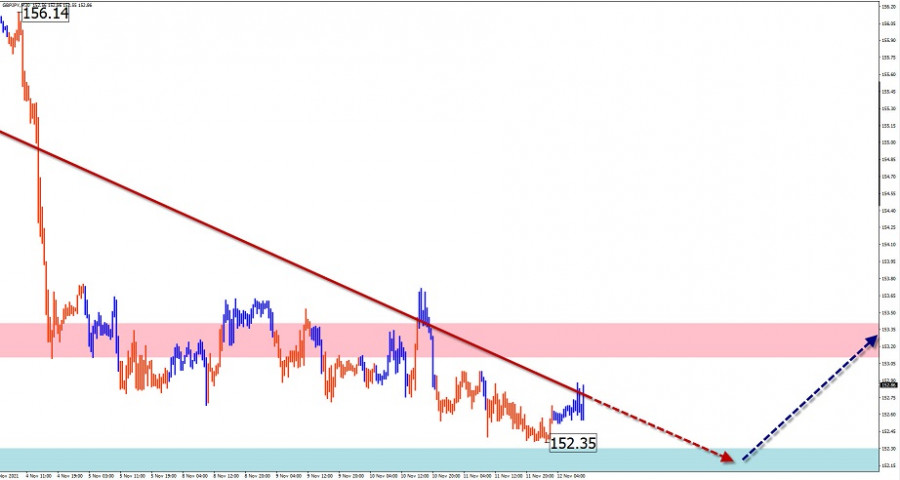
The pound/yen cross continues to move north on the price chart. The price has been forming an intermediate correction from the lower boundary of the strong resistance since October 20. By now the pair has reached a support level.

Forecast:

The general sideways price movement is expected to continue over the next 24 hours. In the second half of the day, after likely pressure on the support zone, a return to an upward vector can be expected, with prices rising towards the resistance zone.

Potential reversal zones

Resistance:

- 153.10/153.40

Support:

- 152.30/152.00

Recommendations:

Trading in this cross pair in the next 24 hours will only be possible in intraday trading with a reduced lot. Buying is more promising today.

This image is no longer relevant

GOLD

Analysis:

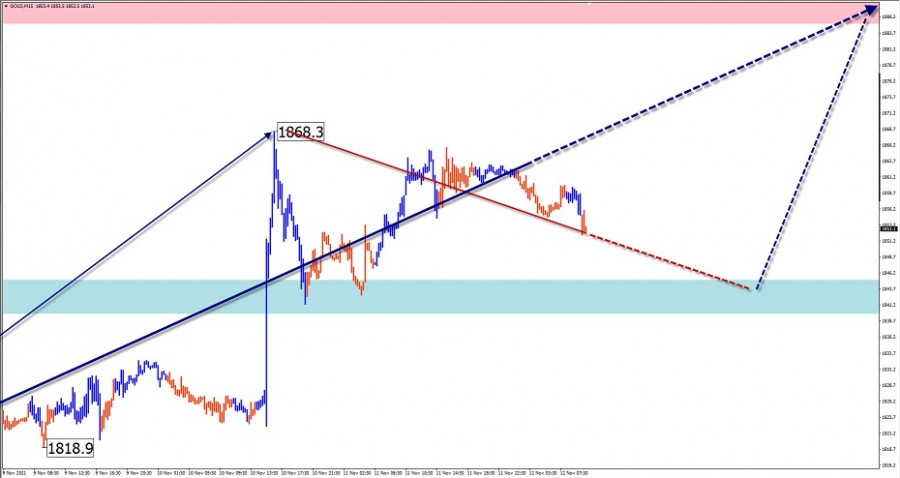
On the gold market, an upward wave has been forming since the end of February. The incomplete portion of the wave dates back to September 30. The gold price is approaching the lower boundary of the potential reversal zone of the senior TF.

Forecast:

Today, the general upward movement is expected to continue. Short-term declines are possible in the European session, but not beyond the support zone. The highest activity is likely by the end of the day.

Potential reversal zones

Resistance:

- 1885.0/1890.0

Support:

- 1845.0/1840.0

Recommendations:

There are no conditions for selling on the gold market today. It is recommended to refrain from entering the instrument until there are clear buying signals around settlement support.

This image is no longer relevant

Explanation: In simplified wave analysis (SVA), waves consist of 3 parts (A-B-C). The last unfinished wave is analysed. The solid arrow background shows the structure formed. The dotted arrow shows the expected movements.

Attention: The wave algorithm does not take into account the duration of the instrument movements over time!

เลือกช่วงเวลา
5
นาที
15
นาที
30
นาที
1
ชั่วโมง
4
ชั่วโมง
1
วัน
1
สัปดาห์
รับผลกำไรจากการเปลี่ยนแปลงอัตราสกุลเงินดิจิทัลกับ InstaForex.
ดาวน์โหลด MetaTrader 4 และเปิดการซื้อขายครั้งแรกของคุณ.
  • Grand Choice
    Contest by
    InstaForex
    InstaForex always strives to help you
    fulfill your biggest dreams.
    เข้าร่วมการแข่งขัน


บทความแนะนำ

การวิเคราะห์ EUR/USD ในวันที่ 2 เมษายน 2025

รูปแบบคลื่นบนกราฟ 4 ชั่วโมงของ EUR/USD กำลังจะเปลี่ยนเป็นโครงสร้างที่ซับซ้อนมากขึ้น ตั้งแต่วันที่ 25 กันยายนของปีที่แล้ว โครงสร้างคลื่นขาลงใหม่ได้เริ่มก่อตัวขึ้น เป็นรูปแบบห้าคลื่น และเมื่อสามเดือนที่ผ่านมามีโครงสร้างการปรับตัวขึ้นที่เริ่มก่อตัวขึ้น ซึ่งควรจะประกอบด้วยคลื่นอย่างน้อยสามคลื่น ลูกคลื่นอันแรกของการปรับตัวนี้มีรูปร่างที่ชัดเจน ดังนั้นฉันยังคาดหวังว่าคลื่นที่สองจะตามมาด้วยโครงสร้างที่ชัดเจน อย่างไรก็ตาม

Chin Zhao 20:25 2025-04-02 UTC+2

การวิเคราะห์ GBP/USD วันที่ 2 เมษายน 2025

รูปแบบคลื่นของ GBP/USD ยังคงค่อนข้างไม่ชัดเจน แต่โดยทั่วไปจัดการได้ดี ขณะนี้มีความเป็นไปได้สูงที่แนวโน้มขาลงระยะยาวกำลังก่อตัวขึ้น คลื่น 5 ได้มีรูปทรงที่ชัดเจน ดังนั้นผมถือว่าคลื่นใหญ่อันดับที่ 1 เสร็จสมบูรณ์ หากสมมุติฐานนี้ถูกต้อง คลื่นอันดับที่ 2 กำลังอยู่ในกระบวนการของการก่อตัว

Chin Zhao 20:23 2025-04-02 UTC+2

การวิเคราะห์ EUR/USD – 1 เมษายน: อัตราเงินเฟ้อในสหภาพยุโรปยังคงลดลง

โครงสร้างคลื่นบนกราฟ EUR/USD ช่วง 4 ชั่วโมง มีความเสี่ยงที่จะกลายเป็นรูปแบบที่ซับซ้อนยิ่งขึ้น เมื่อวันที่ 25 กันยายนของปีที่ผ่านมา โครงสร้างขาลงใหม่ก็เริ่มก่อตัวขึ้น เป็นรูปแบบคลื่นห้าคลื่นแบบสายลักษณ์ เมื่อ 3 เดือนก่อน รูปแบบแก้ไขขาขึ้นเริ่มต้นขึ้น

Chin Zhao 20:05 2025-04-01 UTC+2

การวิเคราะห์ GBP/USD ประจำวันที่ 1 เมษายน 2025

โครงสร้างคลื่นสำหรับ GBP/USD ยังคงมีความคลุมเครืออยู่บ้างแต่ก็ยังสามารถจัดการได้อย่างทั่วไป ขณะนี้มีความน่าจะเป็นสูงที่จะเกิดแนวโน้มขาลงในระยะยาว คลื่นที่ 5 ได้มีรูปแบบที่น่าเชื่อถือ ดังนั้นฉันจึงถือว่าคลื่นใหญ่ที่ 1 ได้เสร็จสิ้นแล้ว หากสมมุติฐานนี้ถูกต้อง คลื่นที่ 2 ยังอยู่ในระหว่างดำเนินการ คลื่นย่อยสองคลื่นแรกภายในคลื่นที่

Chin Zhao 20:00 2025-04-01 UTC+2

การวิเคราะห์ EUR/USD - 31 มีนาคม

โครงสร้างคลื่นบนแผนภูมิ 4 ชั่วโมงของ EUR/USD กำลังมีความเสี่ยงที่จะเปลี่ยนรูปร่างเป็นรูปแบบที่ซับซ้อนยิ่งขึ้น ในวันที่ 25 กันยายนปีที่ผ่านมา โครงสร้างลดลงใหม่เริ่มที่จะการสร้างและอยู่ในรูปแบบของลัพธ์คลื่นห้า สามเดือนที่ผ่านมา โครงสร้างแก้ไขขึ้นเริ่มที่จะการสร้างในที่ควรจะประกอบด้วยคลื่นอย่างน้อยสามคลื่น โครงสร้างของคลื่อแรกถูกสร้างขึ้นอย่างดีและจึงทำให้ฉันคาดว่าคลื่นที่สองจะต้องมีรูปร่างที่ชัดเจนเช่นเดียวกัน อย่างไรก็ตาม ขนาดของคลื่นนี้ใหญ่มากจนเป็นอันตรายถ้ามันเปลี่ยนรูปแบบคลื่นอย่างมาก ข่าวสารที่ส่งออกมายังคงสนับสนุนผู้ขายมากกว่าผู้ซื้อเมื่อมาถึงข้อมูลทางเศรษฐกิจ

Chin Zhao 20:10 2025-03-31 UTC+2

การวิเคราะห์ GBP/USD – 31 มีนาคม: เงินปอนด์หยุดพัก

โครงสร้างคลื่นสำหรับ GBP/USD ยังคงคลุมเครือเล็กน้อย แต่ถือว่ารับได้โดยรวม ปัจจุบันยังมีความเป็นไปได้สูงในการสร้างแนวโน้มขาลงระยะยาว คลื่น 5 ได้เกิดรูปร่างที่น่าเชื่อแล้ว ดังนั้นฉันจึงพิจารณาคลื่นใหญ่ 1 ว่าเสร็จสมบูรณ์ หากสมมติฐานนี้ถูกต้อง คลื่น 2 กำลังพัฒนาเป้าหมายรอบตัวเลข

Chin Zhao 20:08 2025-03-31 UTC+2

การพยากรณ์รายสัปดาห์โดยใช้การวิเคราะห์คลื่นแบบง่ายสำหรับ GBP/USD, AUD/USD, USD/CHF, EUR/JPY, #Ethereum และ #Litecoin ณ วันที่ 31 มีนาคม

GBP/USD การวิเคราะห์: การวิเคราะห์กราฟ 4 ชั่วโมงของเงินปอนด์อังกฤษเผยให้เห็นว่าแนวโน้มขึ้นจากวันที่ 13 มกราคมยังคงไม่เสร็จสมบูรณ์ ส่วนแรก (A) ได้เกิดขึ้นแล้ว ตั้งแต่ต้นเดือนมีนาคม ส่วนกลางของคลื่น (B) กำลังพัฒนาลักษณะการเคลื่อนที่เป็นแนวราบแคบเป็นที่ชัดเจนว่าแต่ยังไม่เสร็จสมบูรณ์ ในช่วงเวลาของการวิเคราะห์

Isabel Clark 11:43 2025-03-31 UTC+2

การคาดการณ์รายสัปดาห์ตามการวิเคราะห์คลื่นที่เรียบง่ายสำหรับ EUR/USD, USD/JPY, GBP/JPY, USD/CAD, #Bitcoin และ #Ripple – วันที่ 31 มีนาคม

EUR/USD การวิเคราะห์: ในระยะสั้น คู่สกุลเงิน EUR/USD ได้เดินตามแนวขาขึ้นล่าสุดที่เริ่มขึ้นตั้งแต่วันที่ 3 กุมภาพันธ์ปีนี้ ในช่วงไม่กี่สัปดาห์ที่ผ่านมา ราคาได้สร้างแนวแก้ไขในรูปแบบแบนที่ยืดออก ขณะนี้ โครงสร้างของคลื่นยังไม่เสร็จสมบูรณ์ ขณะนี้คู่เงินกำลังซื้อขายใกล้ขอบล่างของโซนกลับตัวที่เป็นไปได้ในกรอบเวลารายวัน การพยากรณ์: คาดว่าการเคลื่อนไหวลงของเงินยูโรจะเสร็จสิ้นในไม่กี่วันข้างหน้า

Isabel Clark 11:12 2025-03-31 UTC+2

การวิเคราะห์ EUR/USD – 28 มีนาคม

โครงสร้างคลื่นในกราฟ 4 ชั่วโมงสำหรับ EUR/USD มีแนวโน้มที่จะพัฒนาเป็นรูปแบบที่ซับซ้อนมากขึ้น โครงสร้างลงใหม่เริ่มก่อตัวในวันที่ 25 กันยายน โดยมีรูปแบบเป็นคลื่นห้า-wave ที่เต็มไปด้วยแรงกดดัน สองเดือนก่อนหน้า โครงสร้างขาขึ้นที่มีการแก้ไขเริ่มต้นขึ้นซึ่งควรประกอบด้วยอย่างน้อยสามคลื่น โครงสร้างคลื่นของคลื่นแรกค่อนข้างชัดเจน ดังนั้นฉันจึงคาดหวังว่าคลื่นที่สองจะมีรูปแบบที่ชัดเจนเช่นกัน แต่อย่างไรก็ตามขนาดของคลื่นนี้ใหญ่พอจนสามารถมีผลเปลี่ยนแปลงนับคลื่นปัจจุบันได้อย่างมาก

Chin Zhao 19:10 2025-03-28 UTC+2

วิเคราะห์ GBP/USD – 28 มีนาคม

โครงสร้างคลื่นของเครื่องมือ GBP/USD ยังคงค่อนข้างกำกวม แต่โดยรวมสามารถเข้าใจได้ ในขั้นตอนนี้มีความเป็นไปได้สูงว่ากำลังเกิดเซ็กเมนต์แนวโน้มขาลงในระยะยาว คลื่น 5 ได้มีรูปร่างที่ชัดเจนแล้ว ดังนั้นฉันถือว่าคลื่นย่อยใหญ่ 1 ได้จบลงแล้ว หากข้อสมมตินี้ถูกต้อง คลื่น 2 กำลังดำเนินการอยู่

Chin Zhao 19:07 2025-03-28 UTC+2
หากไม่สะดวกคุยในตอนนี้
ระบุคำถามไว้ได้ใน แชท.
Widget callback
 

Dear visitor,

Your IP address shows that you are currently located in the USA. If you are a resident of the United States, you are prohibited from using the services of InstaFintech Group including online trading, online transfers, deposit/withdrawal of funds, etc.

If you think you are seeing this message by mistake and your location is not the US, kindly proceed to the website. Otherwise, you must leave the website in order to comply with government restrictions.

Why does your IP address show your location as the USA?

  • - you are using a VPN provided by a hosting company based in the United States;
  • - your IP does not have proper WHOIS records;
  • - an error occurred in the WHOIS geolocation database.

Please confirm whether you are a US resident or not by clicking the relevant button below. If you choose the wrong option, being a US resident, you will not be able to open an account with InstaForex anyway.

We are sorry for any inconvenience caused by this message.