empty
08.11.2023 06:40 AM
EUR/USD and GBP/USD: Technical analysis for November 8

EUR/USD

This image is no longer relevant

Higher Timeframes

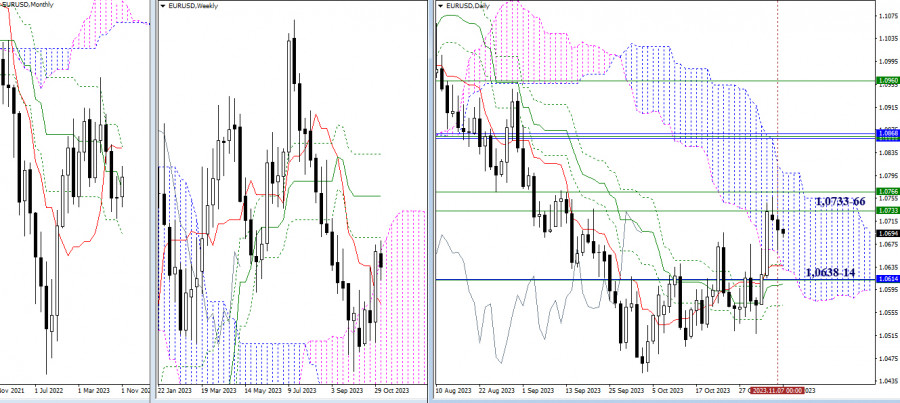
Bears continued the decline yesterday and tested the area of influence of the lower boundary of the daily cloud, but they couldn't hold onto the achieved levels. Today, the situation remains within the limits, with the boundaries being 1.0733 - 1.0766 (weekly levels) and 1.0638 - 1.0614 (daily levels + weekly short-term trend + monthly medium-term trend). A breakdown and a secure consolidation beyond these boundaries will allow us to consider new opportunities and prospects.

This image is no longer relevant

H4 - H1

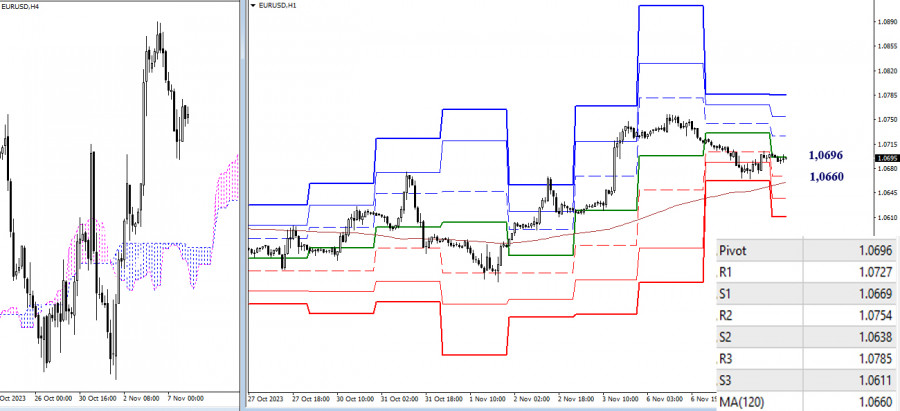
On the lower timeframes, the decline continues, but the market still trades above the weekly long-term trend (1.0660), which continues to favor the bulls. In the case of a recovery of long positions, bullish players may encounter resistance at the classic pivot points (1.0727 - 1.0754 - 1.0785) today. Further decline and a breakdown of the weekly trend (1.0660) will affect the current balance of power, changing preferences towards further strengthening bearish sentiments. Additional intraday support may come from 1.0638 and 1.0611 (support levels of classic pivot points).

***

GBP/USD

This image is no longer relevant

Higher timeframes

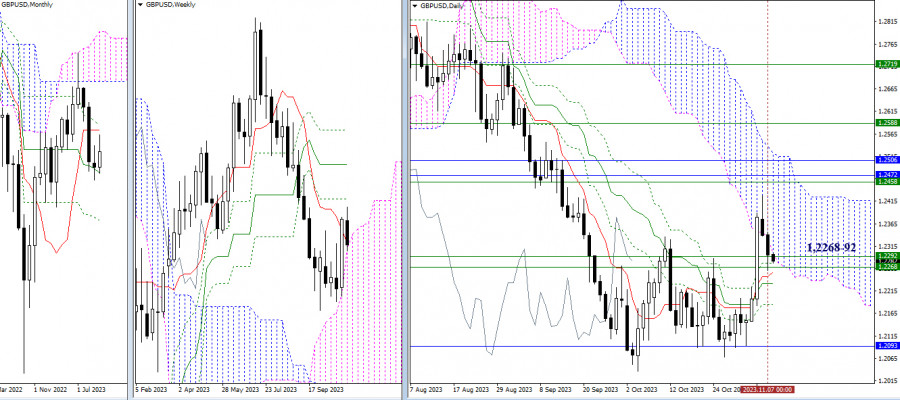
The pound continued its decline and yesterday began to interact with the support area, where the efforts of weekly and daily levels are currently combined (1.2268 - 1.2292). As a result, the most significant task for bearish players at the moment is to break through the zone 1.2268–92 and eliminate the golden cross of the daily Ichimoku cloud at 1.2231 - 1.2185 (final levels). Therefore, in conclusion, the outcome of the current interaction will determine the further development of events in the market.

This image is no longer relevant

H4 - H1

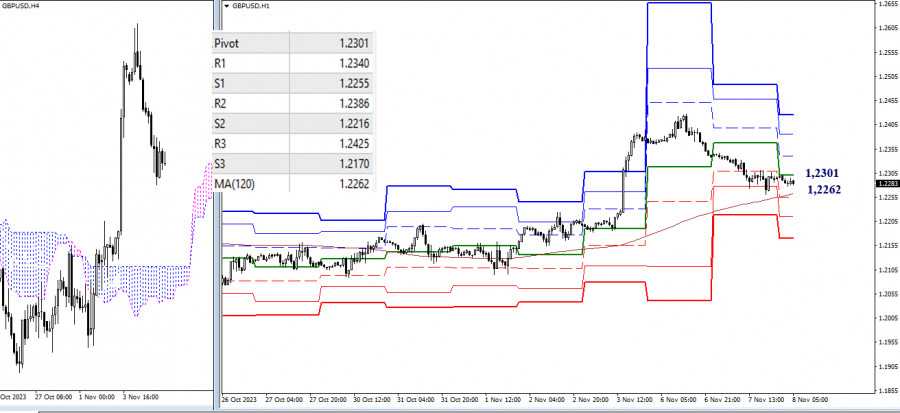
The key levels on the lower timeframes are converging today in the range of 1.2301 - 1.2262 (central pivot point + weekly long-term trend). A breakdown and a reversal of the moving average will help strengthen bearish positions, giving priority to the development of bearish sentiments. Intraday support today can be observed at 1.2255 - 1.2216 - 1.2170 (classic pivot points). A rebound from key levels and the recovery of long positions by bullish players will bring relevance to the resistance levels of the classic pivot points (1.2340 - 1.2386 - 1.2425).

***

The technical analysis of the situation uses:

Higher timeframes - Ichimoku Kinko Hyo (9.26.52) + Fibonacci Kijun levels

Lower timeframes - H1 - Pivot Points (classic) + Moving Average 120 (weekly long-term trend)

เลือกช่วงเวลา
5
นาที
15
นาที
30
นาที
1
ชั่วโมง
4
ชั่วโมง
1
วัน
1
สัปดาห์
รับผลกำไรจากการเปลี่ยนแปลงอัตราสกุลเงินดิจิทัลกับ InstaForex.
ดาวน์โหลด MetaTrader 4 และเปิดการซื้อขายครั้งแรกของคุณ.
  • Grand Choice
    Contest by
    InstaForex
    InstaForex always strives to help you
    fulfill your biggest dreams.
    เข้าร่วมการแข่งขัน


บทความแนะนำ

XAG/USD. การวิเคราะห์และการพยากรณ์

วันนี้ ที่จุดเริ่มต้นของสัปดาห์ใหม่ ราคาซิลเวอร์ดีดตัวขึ้นเหนือระดับจิตวิทยาที่ $33.00 และชดเชยการขาดทุนบางส่วนจากวันศุกร์ อย่างไรก็ตาม การฟื้นตัวในช่วงวันยังขาดแรงผลักดันที่แข็งแกร่ง เมื่อมองในภาพรวมของการฟื้นตัวจากระดับต่ำสุดในเดือนเมษายน ราคาปัจจุบันสามารถมองได้ว่าเป็นส่วนหนึ่งของช่วงการรวมที่เป็นขาขึ้น นอกจากนี้ ออสซิลเลเตอร์ในแผนภูมิรายวันกำลังได้รับแรงบวก สนับสนุนศักยภาพในการฝ่าวงล้อมขึ้นเหนือ อย่างไรก็ตาม การเคลื่อนตัวขึ้นเหนือเจอความต้านทานอย่างหนักในโซนอุปทานที่ $33.50

Irina Yanina 18:40 2025-06-02 UTC+2

สัญญาณการซื้อขายสำหรับ EUR/USD ระหว่างวันที่ 2-5 มิถุนายน 2025: ขายเมื่อราคาต่ำกว่า 1.1474 (21 SMA - 6/8 Murray)

EUR/USD กำลังซื้อขายอยู่รอบๆ 1.1437 ต่ำกว่าระดับ Murray 6/8 และอยู่ภายในช่องแนวโน้มขาขึ้นที่ก่อตัวเมื่อวันที่ 9 พฤษภาคม เครื่องมือนี้มีบริเวณที่ผู้ซื้อพบว่าการทำกำไรได้ง่ายขึ้นรอบๆ 1.1476 ระดับนี้อาจเป็นอุปสรรคสำหรับเงินยูโร และจากจุดนี้เราสามารถคาดการณ์ว่ามันอาจทำให้เกิดการปรับฐานทางเทคนิคได้ หากแรงขาขึ้นยังคงมีอยู่อย่างต่อเนื่อง เงินยูโรอาจไปถึงยอดสูงสุดของช่องแนวโน้มขาขึ้นประมาณ

Dimitrios Zappas 18:38 2025-06-02 UTC+2

สัญญาณการซื้อขายทองคำ (XAU/USD) สำหรับวันที่ 2-5 มิถุนายน 2025: ขายต่ำกว่า $3,3802 (21 SMA - 6/8 Murray)

ทองคำกำลังซื้อขายอยู่ราวๆ 3,374 ซึ่งถึงระดับรีบาวด์ทางเทคนิค 100% ตามตัวบ่งชี้ Fibonacci extension ปัจจุบันทองคำอาจจะยังคงเพิ่มขึ้นในอีกไม่กี่วันข้างหน้า และอาจจะถึงระดับ 161.8% ที่ประมาณ 3,437 ระดับ 8/8 Murray

Dimitrios Zappas 18:36 2025-06-02 UTC+2

การคาดการณ์สำหรับ EUR/USD ในวันที่ 2 มิถุนายน 2025

ในวันศุกร์ คู่เงิน EUR/USD ลดลงไปที่ระดับการปรับฐาน Fibonacci 50.0% ที่ 1.1320 แล้วดีดตัวกลับ และกลับคืนเป็นฝั่งช่วยเหลือยูโร จากนั้นราคาได้เพิ่มขึ้นไปยังโซนแนวต้านที่ 1.1374-1.1380 จากโซนนี้ การดีดตัวกลับและการเปลี่ยนทิศทางในฝั่งของสกุลเงินสหรัฐฯ อาจเกิดขึ้นอีกครั้งวันนี้

Samir Klishi 12:01 2025-06-02 UTC+2

การพยากรณ์สำหรับคู่เงิน GBP/USD ณ วันที่ 2 มิถุนายน 2025

ในกราฟรายชั่วโมง คู่เงิน GBP/USD มีการซื้อขายอยู่ระหว่างระดับ 1.3425 ถึง 1.3520 ในช่องทางแนวนอนเมื่อวันศุกร์ที่ผ่านมา จึงไม่มีสัญญาณการซื้อขายหรือการกลับตัวในวันศุกร์ หลังจากดีดตัวจากระดับ 1.3425 ปอนด์อาจจะยังคงมีแนวโน้มการเคลื่อนไหวขึ้นต่อไป สัปดาห์ใหม่เริ่มต้นด้วยการโจมตีแบบขาขึ้นใหม่ เมื่อทรัมป์ประกาศในช่วงสุดสัปดาห์ถึงความพร้อมในการขึ้นภาษีเหล็กและอลูมิเนียม การปิดเหนือระดับ

Samir Klishi 11:58 2025-06-02 UTC+2

พยากรณ์ฟอเร็กซ์วันที่ 02/06/2025: EUR/USD, GBP/USD, USD/JPY, USDX, ทองคำ และ Bitcoin

ลิงก์ที่มีประโยชน์: บทความอื่นๆ ของฉันสามารถอ่านได้ในส่วนนี้ หลักสูตรสำหรับมือใหม่ของ InstaForex การวิเคราะห์ยอดนิยม เปิดบัญชีซื้อขาย สำคัญ: ผู้เริ่มต้นในการเทรดฟอเร็กซ์จำเป็นต้องระมัดระวังเป็นอย่างมากเมื่อทำการตัดสินใจเกี่ยวกับการเข้าตลาด ก่อนหน้าการเผยแพร่รายงานสำคัญ ควรหลีกเลี่ยงการเข้าสู่ตลาดเพื่อป้องกันไม่ให้เผชิญกับความผันผวนที่เพิ่มขึ้นของตลาด หากคุณตัดสินใจที่จะเทรดในช่วงที่มีการเผยแพร่ข่าว ควรตั้งคำสั่งหยุดขาดทุนเสมอเพื่อลดการสูญเสียให้น้อยที่สุด หากไม่ตั้งคำสั่งหยุดขาดทุน คุณอาจสูญเสียเงินฝากทั้งหมดได้อย่างรวดเร็วโดยเฉพาะถ้าคุณไม่ใช้การจัดการเงินและเทรดด้วยปริมาณมาก

Sebastian Seliga 09:34 2025-06-02 UTC+2

การวิเคราะห์ทางเทคนิคของการเคลื่อนไหวของราคาในวันเดียวกันสำหรับเครื่องมือทางการเงินของสินค้าทองคำ วันจันทร์ที่ 2 มิถุนายน 2025

ถ้าเรามาพิจารณาราคาทองบนกราฟ 4 ชั่วโมง จะเห็นได้ว่าการเคลื่อนไหวของราคาทองกำลังเคลื่อนที่อยู่เหนือเส้น WMA (21) ซึ่งสภาวะนี้บ่งชี้ถึงโมเมนตัมที่แข็งแกร่งขึ้นของทอง ข้อนี้ยังได้รับการยืนยันเพิ่มเติมจากการเกิดการ (Convergence) ระหว่างการเคลื่อนไหวของราคาทองและตัวชี้วัด Stochastic Oscillator ซึ่งเพิ่มการยืนยันการแข็งแกร่งที่จะเกิดขึ้นในเครื่องมือนี้ โดยที่ระดับ 3330.63

Arief Makmur 08:48 2025-06-02 UTC+2

การวิเคราะห์ทางเทคนิคการเคลื่อนไหวราคาภายในวันของคู่สกุลเงินหลัก EUR/USD วันจันทร์ ที่ 2 มิถุนายน 2025

ในขณะนี้ บนกราฟ 4 ชั่วโมงของคู่เงินหลัก EUR/USD มีแนวโน้มเคลื่อนที่อยู่เหนือ WMA (21) ซึ่งติดตามด้วยแนวโน้มที่กำลังสูงขึ้น และสภาวะของตัวบ่งชี้ Stochastic Oscillator ที่แสดงสัญญาณ Crossing

Arief Makmur 08:48 2025-06-02 UTC+2

การคาดการณ์สำหรับ EUR/USD ในวันที่ 2 มิถุนายน 2025

ยูโรปิดวันศุกร์ด้วยแท่งเทียนสีดำ แต่ยังคงอยู่เหนือเส้นสมดุลและเส้นบ่งชี้ MACD ระหว่างเซสชั่นแปซิฟิกวันนี้ ราคาขยับสูงกว่าเปิดของวันศุกร์และเข้าใกล้ระดับสูงสุดของราคา เส้นสัญญาณของ Marlin oscillator ได้หันขึ้นจากเส้นค่าเฉลี่ยศูนย์ แน่ชัดว่าเป้าหมายที่ระดับ 1.1420 มีโอกาสที่จะถูกทำลายเร็ว ๆ นี้ การทะลุแนวต้านเหนือระดับนี้จะเปิดทางไปสู่เป้าหมายที่

Laurie Bailey 04:36 2025-06-02 UTC+2

การคาดการณ์ GBP/USD ในวันที่ 2 มิถุนายน 2025

ค่าเงินปอนด์อังกฤษที่ค่อยๆ ฟื้นตัวขึ้นจากแนวรับที่ระดับ 1.3433 ซึ่งเกิดขึ้นเมื่อวันที่ 29 พฤษภาคม. เริ่มต้นวันด้วยการเติบโตเชิงบวก (ราคาปัจจุบันได้สูงกว่าระดับเปิดของวันศุกร์และวันพฤหัสบดีแล้ว) ขณะนี้กำลังมุ่งหน้าไปยังจุดแม่เหล็กที่เกิดจากระดับเป้าหมายที่ 1.3635 และเส้นช่องราคาที่กำหนดไว้. การเติบโตเพิ่มเติมอาจเป็นไปได้ที่ขอบบนของช่องราคาที่บริเวณเครื่องหมาย 1.3790 หรือสูงกว่านั้น —

Laurie Bailey 04:30 2025-06-02 UTC+2
หากไม่สะดวกคุยในตอนนี้
ระบุคำถามไว้ได้ใน แชท.
Widget callback
 

Dear visitor,

Your IP address shows that you are currently located in the USA. If you are a resident of the United States, you are prohibited from using the services of InstaFintech Group including online trading, online transfers, deposit/withdrawal of funds, etc.

If you think you are seeing this message by mistake and your location is not the US, kindly proceed to the website. Otherwise, you must leave the website in order to comply with government restrictions.

Why does your IP address show your location as the USA?

  • - you are using a VPN provided by a hosting company based in the United States;
  • - your IP does not have proper WHOIS records;
  • - an error occurred in the WHOIS geolocation database.

Please confirm whether you are a US resident or not by clicking the relevant button below. If you choose the wrong option, being a US resident, you will not be able to open an account with InstaForex anyway.

We are sorry for any inconvenience caused by this message.