

signal strength 2 of 5
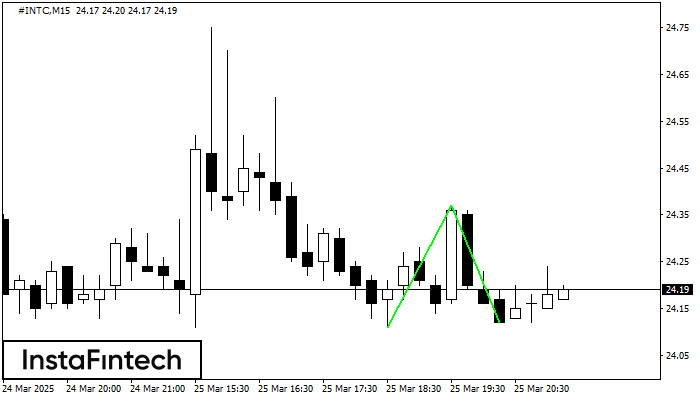
The Double Bottom pattern has been formed on #INTC M15; the upper boundary is 24.37; the lower boundary is 24.12. The width of the pattern is 26 points. In case of a break of the upper boundary 24.37, a change in the trend can be predicted where the width of the pattern will coincide with the distance to a possible take profit level.
The M5 and M15 time frames may have more false entry points.
ดูเพิ่มเติม
- All
- Double Top
- Flag
- Head and Shoulders
- Pennant
- Rectangle
- Triangle
- Triple top
- All
- #AAPL
- #AMZN
- #Bitcoin
- #EBAY
- #FB
- #GOOG
- #INTC
- #KO
- #MA
- #MCD
- #MSFT
- #NTDOY
- #PEP
- #TSLA
- #TWTR
- AUDCAD
- AUDCHF
- AUDJPY
- AUDUSD
- EURCAD
- EURCHF
- EURGBP
- EURJPY
- EURNZD
- EURRUB
- EURUSD
- GBPAUD
- GBPCHF
- GBPJPY
- GBPUSD
- GOLD
- NZDCAD
- NZDCHF
- NZDJPY
- NZDUSD
- SILVER
- USDCAD
- USDCHF
- USDJPY
- USDRUB
- All
- M5
- M15
- M30
- H1
- D1
- All
- Buy
- Sale
- All
- 1
- 2
- 3
- 4
- 5

M5 চার্ট অনুসারে, NZDCHF বুলিশ রেক্ট্যাঙ্গেল গঠন করেছে যা চলমান প্রবণতার ধারাবাহিকতার প্যাটার্ন। প্যাটার্নটি নিম্নলিখিত সীমানার মধ্যে রয়েছে: নীচের সীমানা 0.4915 – 0.4915 এবং উপরের সীমানা 0.4932 – 0.4932৷ উপরের
M5 এবং M15 টাইম ফ্রেমে আরও ভুল এন্ট্রি পয়েন্ট থাকতে পারে।
Open chart in a new window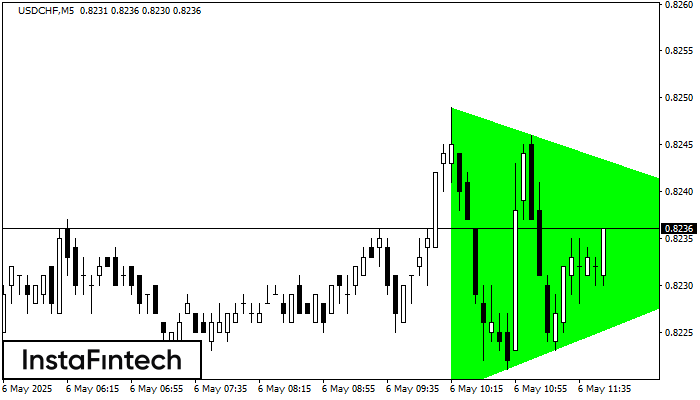
M5 চার্ট অনুযায়ী, USDCHF বুলিশ সিমেট্রিকাল ট্রায়াঙ্গেল প্যাটার্ন গঠন করেছে। প্যাটার্নের নীচের সীমানা 0.8219/0.8235-এর কোঅর্ডিনেটগুলো স্পর্শ করেছে যেখানে উপরের সীমানাটি 0.8249/0.8235 জুড়ে যাচ্ছে৷ যদি বুলিশ সিমেট্রিকাল ট্রায়াঙ্গেল প্যাটার্নটি বজায় থাকে
M5 এবং M15 টাইম ফ্রেমে আরও ভুল এন্ট্রি পয়েন্ট থাকতে পারে।
Open chart in a new window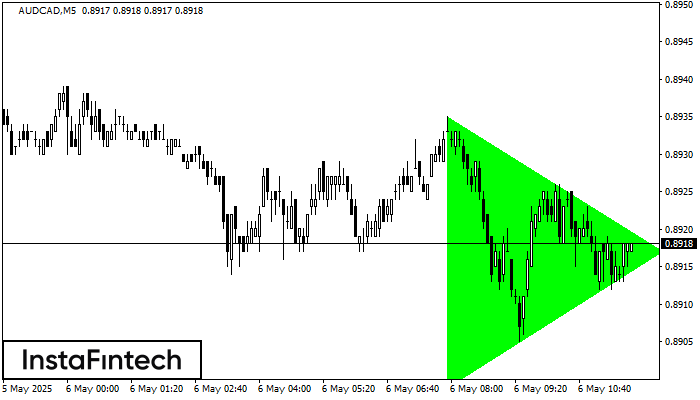
M5 চার্ট অনুযায়ী, AUDCAD বুলিশ সিমেট্রিকাল ট্রায়াঙ্গেল প্যাটার্ন গঠন করেছে। প্যাটার্নের নীচের সীমানা 0.8899/0.8917-এর কোঅর্ডিনেটগুলো স্পর্শ করেছে যেখানে উপরের সীমানাটি 0.8935/0.8917 জুড়ে যাচ্ছে৷ যদি বুলিশ সিমেট্রিকাল ট্রায়াঙ্গেল প্যাটার্নটি বজায় থাকে
M5 এবং M15 টাইম ফ্রেমে আরও ভুল এন্ট্রি পয়েন্ট থাকতে পারে।
Open chart in a new window


