


signal strength 2 of 5

The Triple Top pattern has formed on the chart of the GOLD M15 trading instrument. It is a reversal pattern featuring the following characteristics: resistance level 76, support level -995, and pattern’s width 1554. Forecast If the price breaks through the support level 3111.14, it is likely to move further down to 3124.98.
The M5 and M15 time frames may have more false entry points.
ดูเพิ่มเติม
- All
- Double Top
- Flag
- Head and Shoulders
- Pennant
- Rectangle
- Triangle
- Triple top
- All
- #AAPL
- #AMZN
- #Bitcoin
- #EBAY
- #FB
- #GOOG
- #INTC
- #KO
- #MA
- #MCD
- #MSFT
- #NTDOY
- #PEP
- #TSLA
- #TWTR
- AUDCAD
- AUDCHF
- AUDJPY
- AUDUSD
- EURCAD
- EURCHF
- EURGBP
- EURJPY
- EURNZD
- EURRUB
- EURUSD
- GBPAUD
- GBPCHF
- GBPJPY
- GBPUSD
- GOLD
- NZDCAD
- NZDCHF
- NZDJPY
- NZDUSD
- SILVER
- USDCAD
- USDCHF
- USDJPY
- USDRUB
- All
- M5
- M15
- M30
- H1
- D1
- All
- Buy
- Sale
- All
- 1
- 2
- 3
- 4
- 5
was formed on 15.04 at 01:15:13 (UTC+0)
signal strength 1 of 5

รูปแบบ รูปแบบกราฟจุดสามยอดขาลง (Triple Bottom) ได้ถูกสร้างขึ้นมาใน #Bitcoin M5 มันมี คุณลักษณะ ดังต่อไปนี้: ระดับแนวต้าน 84720.65/84653.62; ระดับของแนวรับ 84401.53/84425.81; ความกว้างคือ
ขอบเตระยะเวลาใน M5 และ M15 อาจจะมีตำแหน่งการเข้าใช้งานที่ผิดพลาดมากยิ่งขึ้น
Open chart in a new windowwas formed on 15.04 at 01:15:03 (UTC+0)
signal strength 2 of 5
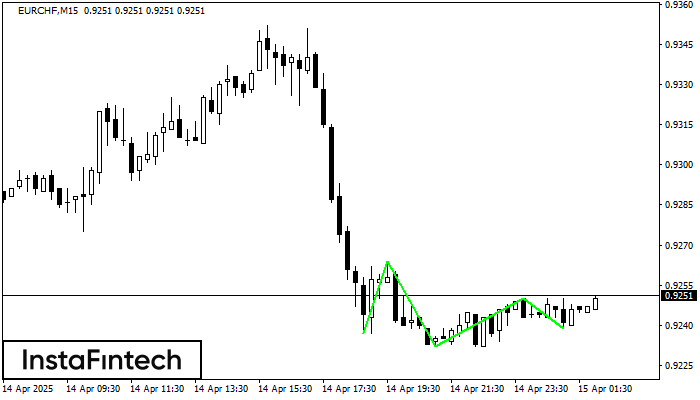
รูปแบบ รูปแบบกราฟจุดสามยอดขาลง (Triple Bottom) ได้สร้างขึ้นมาในชาร์ตของ EURCHF M15 ที่เป็นตราสารการซื้อขาย รูปแบบนี้แสดงถึงการเปลี่่ยนแปลงในแนวโน้มจากแนวโน้มขาลง ไปเป็นแนวโน้มขาขึ้น ในกรณีที่มีการเคลื่อนตัวทะลุผ่านที่ 0.9264/0.9250
ขอบเตระยะเวลาใน M5 และ M15 อาจจะมีตำแหน่งการเข้าใช้งานที่ผิดพลาดมากยิ่งขึ้น
Open chart in a new windowwas formed on 15.04 at 01:05:33 (UTC+0)
signal strength 3 of 5
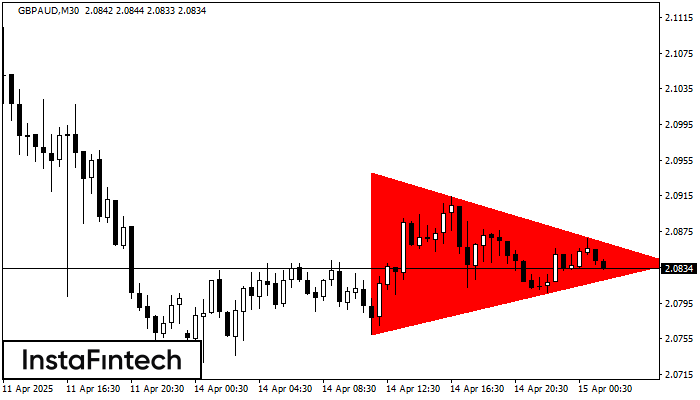
อ้างอิงจากชาร์ตของ M30, GBPAUD ที่ได้สร้างรูปแบบ รูปแบบสามเหลี่ยมสมมาตรขาลง (Bearish Symmetrical Triangle) ออกมา รูปแบบนี้แสดงถึงแนวโน้มขาลงที่เกิดขึ้นต่อไป ในกรณีที่ขอบเขตด้านล่าง 2.0760 จะมีการเคลื่อนตัวทะลุผ่าน4f ส่วนนี้ เป็นผลกำไรที่คาดการณ์ไว้
Open chart in a new window


